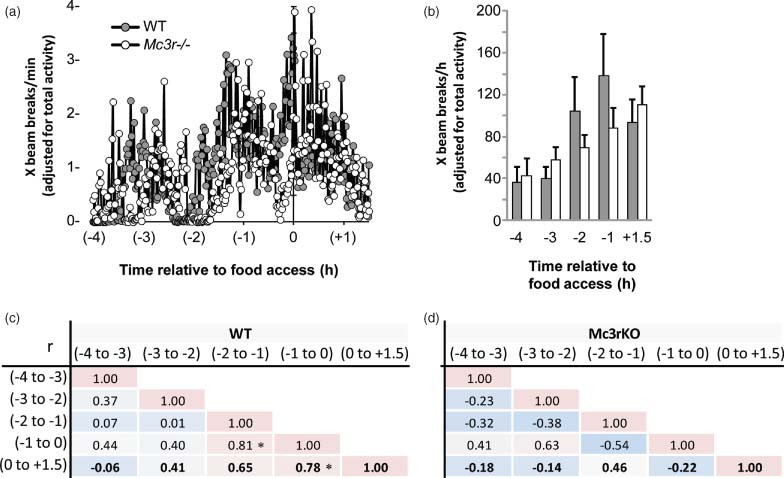
Figure 4. Attenuated expression of the food anticipatory response in Mc3r−/−mice.

(a) Locomotor activity data expressed as X-beam breaks per minute (adjusted for 24-h activity). WT mice display a gradual increase in the intensity of activity up to the time of food access. Mc3r−/− mice display a delayed expression of anticipatory activity, while a peak in activity that coincides with food access in WT mice is not evident. (b) Expression of activity as 1-h bins showing the gradual increase in intensity of activity in WT that anticipate food presentation. (c) Correlation matrix displaying the relationship between activity in the 1-h intervals leading up to and the 90-min period following food access. WT mice display a gradual increase in consistency of activity leading up to food access (*P < 0.05). (d) In contrast, hourly activity of Mc3r−/− mice displays more variability during the period leading up to food presentation.
