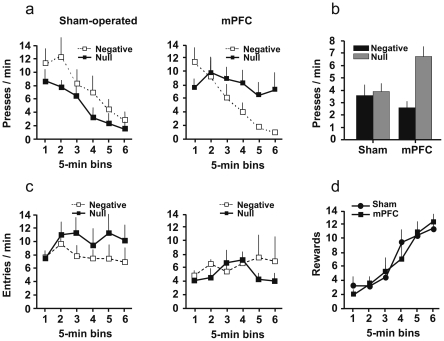
Figure 3. Adaptation to contingency changes.
a) Evolution of the rate of lever-pressing during the session of contingency change in blocks of 5 min. (mean + s.e.), according to lesion and condition b) final rate of response at test. Data are expressed as mean rates of responding. c) Evolution of the rate of entries into the empty magazine during the session of contingency change (mean + s.e.). d) Evolution of absolute number of rewards delivered during the session of contingency change in blocks of 5 min., according to lesion. Equal rewards are delivered in both conditions. Negative: negative contingency condition; Null: null contingency condition.

