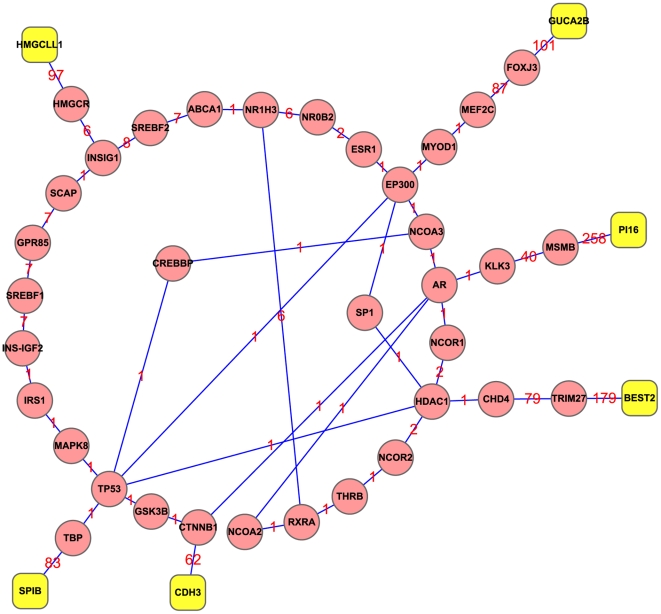
Figure 2. 15 shortest paths between the six genes identified with mRMR method.
The 15 shortest paths between the six candidate genes were identified with Dijkstra's algorithm based on the PPI data from STRING. Yellow roundrect represents the top six candidate genes identified by the mRMR method. Red round represents the 35 genes existing within the range of the shortest paths. Numbers on edges represent the edge weights to quantify the interaction confidence. The smaller the number is, the stronger the interaction between two nodes is. See the text in the Section of “Graph approach and shortest paths tracing” for the quantitative relation of the edge weight with the confidence score between two proteins concerned.

