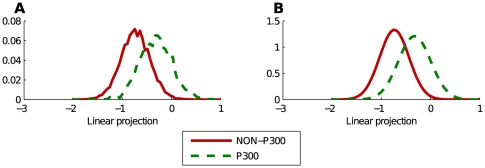
Figure 3. The projection of the EEG into one dimension produces two Gaussians.
Figure A shows the histogram of the used EEG features projected into one dimension. Figure B shows two Gaussians fitted to this histogram. One Gaussian for the EEG containing the P300 response, one Gaussian for the data without P300 response. The vector  that was used in the projection was trained unsupervisedly on the data.

