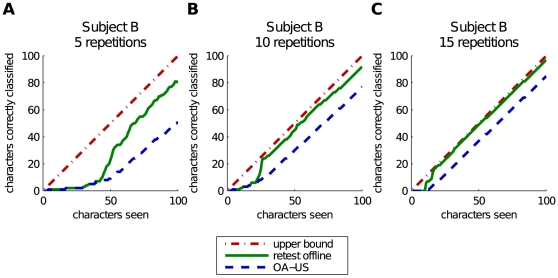
Figure 7. Plots showing the performance obtained by 3 single online initializations on subject B, each using a different number of repetitions to predict a character.
The horizontal axis represents the number of characters processed. The vertical axis represents how many of these characters were predicted correctly. The dashed line shows us how many characters the online classifier has predicted correctly (starting with an initially untrained classifier). The solid line shows how many characters the current classifier can predict correctly if we re-test it on all of the previously processed characters. The dash-dot line represents the upper bound on the performance which equals the number of characters seen.

