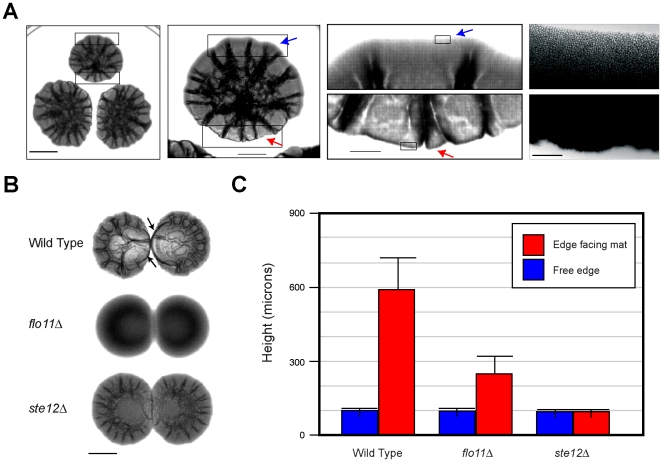
Figure 3. MAPK- and Flo11-dependent colony avoidance response.
A) Wild-type cells were spotted in three spots and examined daily. The photograph showing the embossed appearance of colonies was taken at day 3. Left three panels, Bar = 1 cm. Far right panel, micrograph of cells at the perimeter of an asymmetrically forming biofilm. Bar, 200 microns. Mat borders facing (red arrows) or not facing (blue arrows) another mat are indicated. B) Wild type (PC538), flo11Δ (PC1029), and ste12Δ (PC2382) cells were grown on YEPD media for 18 h. Equal concentrations of cells were spotted, 1 cm apart, on to YEPD media containing 0.3% agar. Plates were incubated for 48 h at 30°C and photographed using transmitted light. Bar = 1 cm. C) Bar graph of height measurements (in mm) of the mat borders facing/not facing the adjacent mats on the right in B. Contour maps in the Z-axis of mats was generated. Seven readings after the first peak in the Z-axis were averaged to plot the graph. Standard deviation between measurements were used to generate the error bars.

