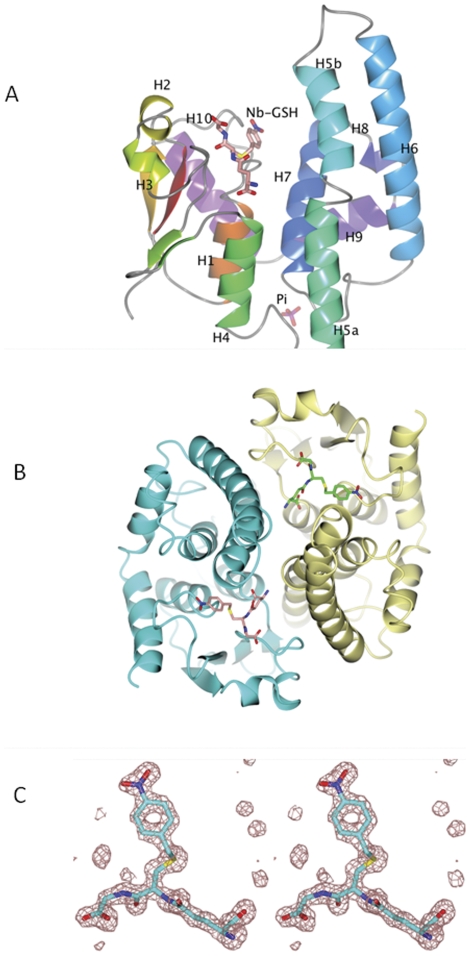
Figure 3. Crystal structure of AtuGSTH1-1.
A. Ribbon diagram of AtuGSTH1-1 monomer. Assignment of secondary structure elements was carried out by DSSP [55]. The bound Nb-GSH and phosphate ion are shown as sticks coloured according to atom type. B. Ribbon diagram of the dimeric AtuGSTH1-1 structure. The 2-fold axis is perpendicular to the plane of the page. Subunit A is colored in cyan and subunit B is in lemon yellow. The inhibitor Nb-GSH is represented with sticks and coloured according to atom type. C. Stereo view of the mFo-DFc electron density omit map for the bound Nb-GSH contoured at 3σ. The figures were produced using the CCP4 molecular graphics program [56].

