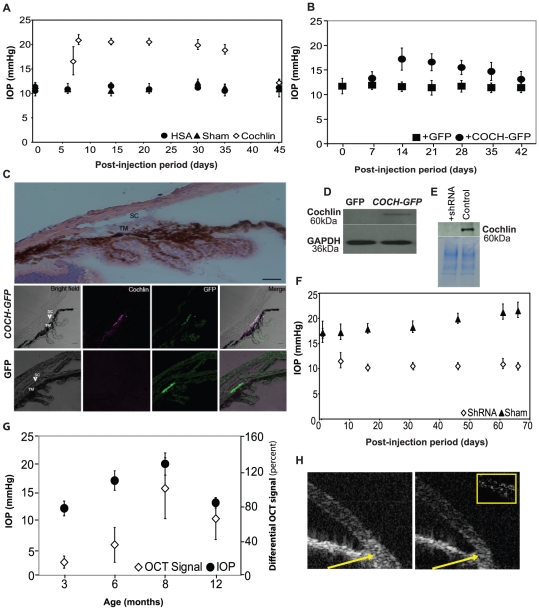
Figure 1. Elevated recombinant cochlin expression in mice TM is concomitant with the IOP elevation.
(A) DBA/2J-Gpnmb+/SjJ mice (n = 42–48 for each vector at each time point, as indicated by the symbols) at six months of age were injected with a lentiviral vector bearing the COCH-GFP transgene or GFP alone (sham) or human serum albumin (HSA) in the anterior chamber (all under the control of a CMV promoter). IOP was recorded at the indicated time periods. (B) C57BL/6J mice at six months of age were injected with a lentiviral vector bearing the COCH-GFP transgene (n = 20) or GFP alone (n = 20) in the anterior chamber. The mice were followed and IOP recorded at the indicated time periods. (C) Representative immunohistochemical analysis of DBA/2J-Gpnmb+/SjJ mice eyes injected with COCH-GFP transgene or GFP alone. Top panel shows the anatomy of the anterior chamber stained with haematoxylin and eosin. SC = Schlemm's canal, TM = trabecular meshwork; Bar = 125 µm Bottom panels show eyes injected with COCH-GFP or GFP alone as indicated. The brightfield and antibody probing for cochlin (magenta), GFP (green) and merge image has been shown as indicated. Scale bar = 100 µm (D) Western analysis of the TM protein extract of the DBA/2J-Gpnmb+/SjJ mice injected with GFP alone or COCH transgene with IRES mediated GFP expression (COCH-GFP). GAPDH has been shown as a loading control. (E) Western analysis of the TM extracts of DBA/2J mice (8 months old) un-injected control or injected with cochlin shRNA. Coomassie blue stained gel shows total protein loading. (F) Downregulation of cochlin in DBA/2J cochlin+/+ mice decreases the mean IOP. DBA/2J cochlin+/+ mice (n = 38–45 for each vector at each point) at six months of age were injected with a lentiviral vector bearing cochlin shRNA or GFP alone in the anterior chamber. IOP was recorded at the indicated time periods. (G) Level of cochlin expression in the TM of DBA/2J cochlin+/+ mice correlates with the IOP. The level of cochlin expression was quantified at different ages (n = 10 at each age group) in vivo using the spectral domain OCT (experimental procedures) and IOP are represented by hollow and solid symbols respectively. (H) Representative SD OCT image of the anterior chamber angle a 6 month old DBA/2J cochlin+/+ mice before (left) and after (right) injection of infra-red (IR-800) dye coupled anti-cochlin antibody. The arrow indicates the region undergoing a change in intensity of signal before and after injection. The images obtained before and after injection were digitally subtracted for the region of interest (inset). Error bars (A, B, F and G) depict ± standard deviation.

