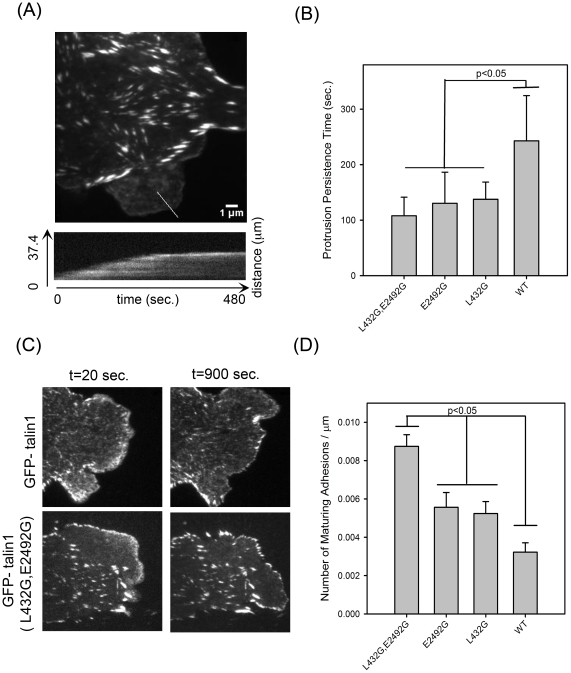
Figure 7. Quantification of the protrusion persistence and number of maturing adhesions in CHO.K1 cells expressing mutants of GFP-talin1.
(A) Average fluorescence image and kymograph from a TIRF time series of a CHO.K1 cell expressing GFP-talin 1 (E2492G) plated on 2 µg/ml FN for 20–30 minutes. Images were collected every 0.5 seconds for 8–10 minutes. The kymograph (bottom) of the highlighted protrusion (red line, top) indicates a persistence time of ∼230 seconds. (B) Plot of the persistence times for GFP-talin1, GFP-talin1 (L432G), GFP-talin1 (E2492G), and GFP-talin1 (L432G, E2492G) shows longer protrusion persistence time in cells expressing wild-type GFP-talin1 compared to the single and double point mutants of GFP-talin1. The number of protrusions (Nprot.) and cells (Ncells) included in the analysis was 9,3 (L432G, E2492H); 11,4 (L432G); 9,3 (E2492G); 11,5 (WT) respectively. (C) TIRF images selected from earlier (20 sec.) and later (900 sec.) time points of the above data set. The number and size of adhesions that stabilize and mature as the cell edge protrudes was greater in GFP-talin1 (L432G, E2492G) compared to wild-type GFP-talin1. The average number of adhesions that stabilize per cell edge protrusion is presented in (D). Number of cells (Ncells) included in the analysis was 5 (WT), 6(E2492G), 4 (L432G), 5 (L432G, E2492G). Error bars are SEM. The Holm-Sidak method was used to test the statistical significance of the pairwise differences in the distributions.

