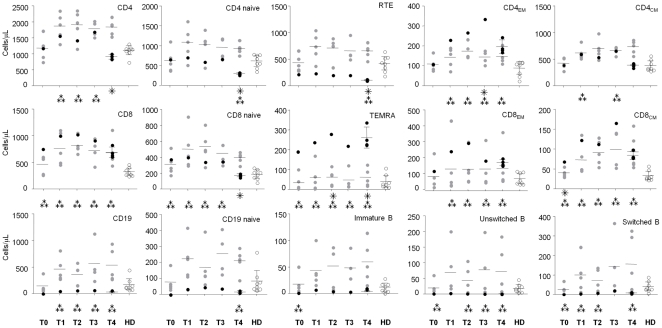
Figure 2. Absolute numbers of the studied cell subtypes.
Absolute numbers of the indicated cell subtypes were analyzed as reported in Figure S1 and at the time points described in Table 1, of the patient who developed PML (pmlMS; black dots), natalizumab-treated patients (nMS; gray dots), and healthy donors (HD; white dots). Four samples were analyzed at the time point T4 in the pmlMS patient. ??? significant differences between cell subsets of the pmlMS patient in comparison to those of nMS patients; ??? significant differences between cell subsets of the pmlMS patient in comparison to those of HD. Horizontal lines indicate means and error bars indicate the 95% confidence intervals of the means.

