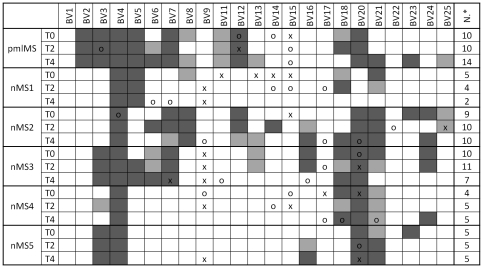
Figure 4. T-cell repertoire heterogeneity.
Percent usage of TCRBV and perturbations of TCR CDR3 length distributions at the indicated time points in the patient who developed PML (pmlMS) and patients treated with natalizumab (nMS1 to nMS5) were determined by spectratyping analysis. The TCRBV chains were considered overused when their percent usage was higher than mean+2SD (“x") or mean+3SD (“o") of the TCRBV chain usage found in 5 healthy donors (HD). Perturbations were obtained by calculating the generalized Hamming distance according to Gorochov et al. [26] and were considered significant when their values were beyond the mean+2SD (light gray squares) or the mean+3SD (dark gray squares) of the CDR3 distribution found in HD. N*: number of perturbed TCRBV chains at each time point.

