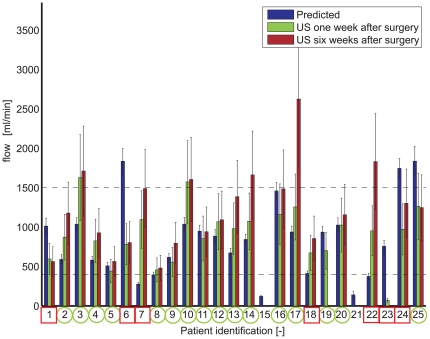
Figure 3. Schematic visualization of predicted and measured postoperative flows for the AVF configuration created by the vascular surgeon.
The error bars in predicted flow are the result of inaccuracies in input parameters, while the error bars in postoperative flow are the result of measurement inaccuracies21. For patient #15 prosthetic graft material was used for VA creation. For patient #21 no postoperative flow measurements could be obtained due to immediate thrombosis. A green circle around the patient identification represents overlap between predicted and measured postoperative flow (16 patients). A red square around the patient identification represents a discrepancy between predicted and measured postoperative flow (7 patients). Note that patient #24 received an alternative AVF configuration (cephalic vein was anastomosed with the ulnar artery on the upper arm due to a high brachial artery bifurcation).

