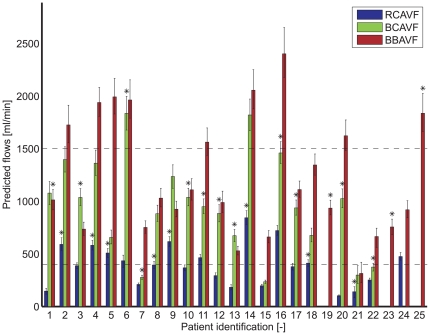
Figure 4. The predicted postoperative flows for a RCAVF, BCAVF and BBAVF configuration.
The flows are presented as the median of all Monte Carlo simulations with their 25th and 75th percentile interval. In 4 patients postoperative brachial artery flow could not be simulated for all three AVF configurations because essential patient-specific data were missing due to thrombosis of the cephalic vein (patient #19, #23, and #25) or because the computations did not converge for all Monte Carlo simulations (patient #24). An asterix represents the fistula configuration chosen by the surgeon.

