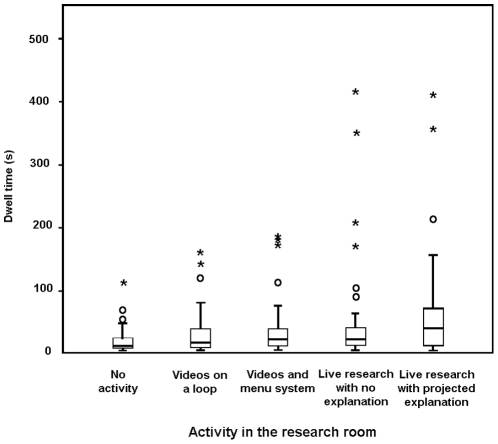
Figure 9. Visitor dwell times at the research windows during public engagement activities: No activity or videos showing (N = 50); videos presented on a continuous 3-minute loop (N = 50); videos selectable via touch sensitive buttons (see Table S1) (N = 50); live research without an explanatory PowerPoint slide (N = 50) and live research with a brief explanatory PowerPoint slide and an appropriate photograph of the research (N = 50).
Central bar is median, box indicates the upper and lower quartile for the middle 50%, and whisker the upper and lower 25%. Asterisks and circles show outliers.

