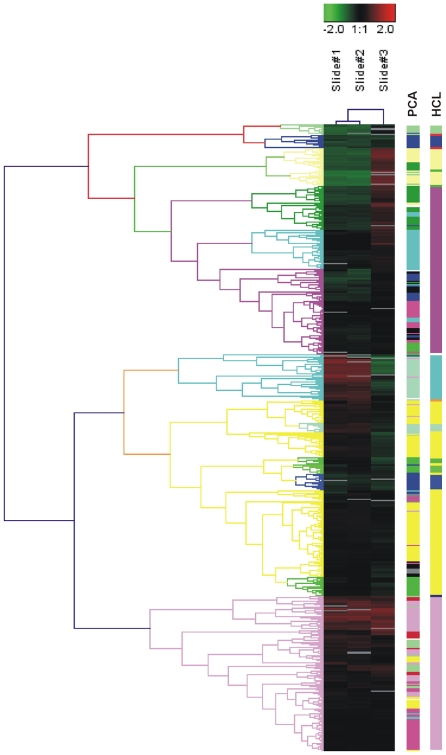
Figure 2. Unsupervised hierarchical cluster analysis diagram based on 529 probe sets with highest variation in SD vs. HFD mice.
Color saturation is directly proportional to measured expression ratio magnitude. Rows represent individual probe set. Columns represent experimental sample. Red bars indicate high expression. Green bars indicate low expression. Slides 1 and 2: control (SD) mice, slide3: sample (HFD) mice. SD; standard diet. HFD; high-fat diet.

