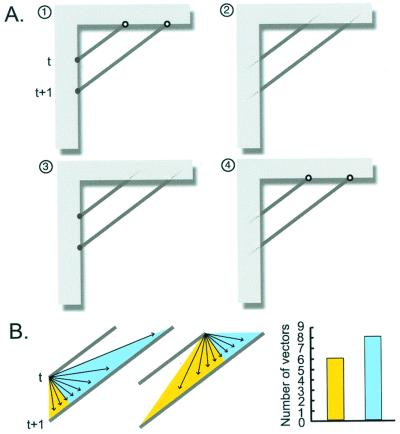
Figure 5.
Empirical explanation of the biases in the perceived direction of motion of a line translating in the frontal parallel plane. (A) The four possible conditional relationships (1–4) pertinent to the projection lines in Fig. 4; see text for detailed explanation. (B) The two diagrams on the Left show that for a line oriented at an angle less than 45° with respect to the horizontal axis, there are more possible translational velocities whose direction of movement is to the right (vectors in the area shaded blue) than downward (vectors in the areas shaded yellow). The histogram on the Right shows this difference in terms of the number of vectors illustrated in Left. (Note that this preponderance of possible sources of translation will always bias perception toward the longer distance traveled along the side of the aperture; conversely, sources arising from deformation will bias perception toward the shorter distance traveled along side of the aperture.)

