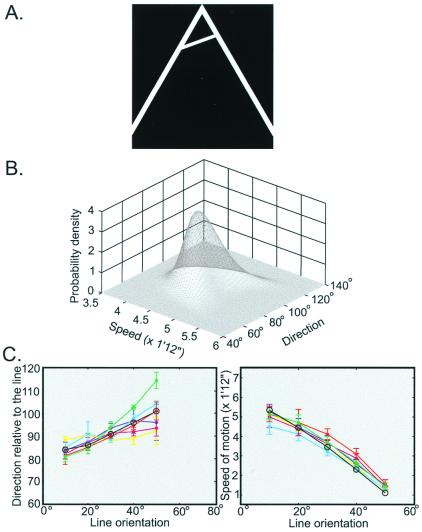
Figure 6.
Comparison of the perceived motion of a line moving across an inverted V aperture with a vertex angle of 60° and the values predicted. (A) A representative stimulus (line orientation = 20°). (B) Probability distribution of possible translations underlying the stimulus in A. (C) The directions (Left) and speeds (Right) of the motion perceived. Different colors represent data for each different subject. The black lines with circles are the predictions of the theory. In this experimental condition, w1 = 0, w2 = 0.18, w1,2 = 0.82, K1 = 2.80, Kr = 9.80.

