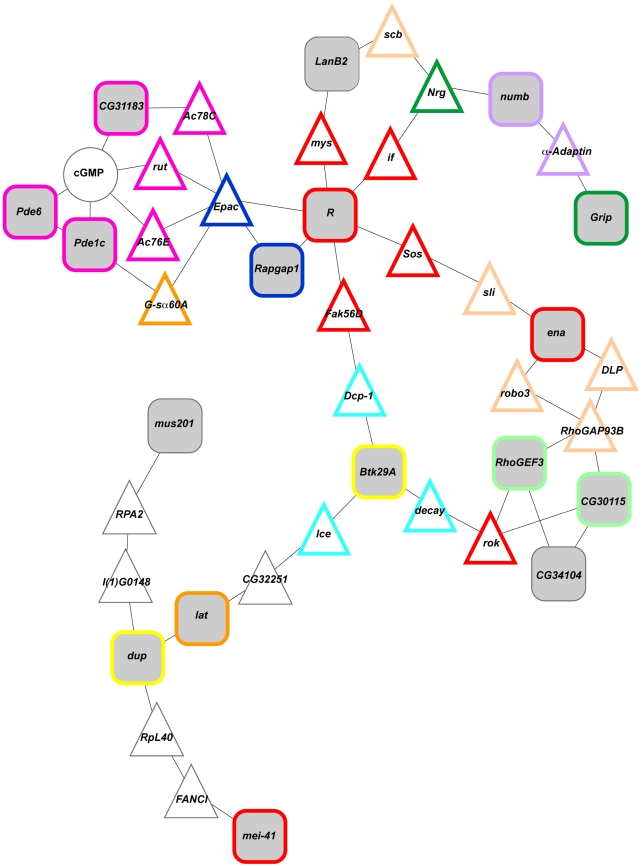
Figure 7. A cellular network among candidate genes.
This diagram depicts an enriched network (P = 0.005) among candidate genes with at least one significant SNP detected in GWA analysis. Candidate genes are indicated by grey filled squares, missing genes (i.e., genes without significant associations) by white filled triangles and metabolites by white filled circles. Gene ontology categories are represented by boarders other than black (magenta, purine metabolism; peach, axon guidance; aqua, apoptosis; yellow, DNA endoreduplication; purple, asymmetric cell division; navy blue, regulation of small GTPase mediated signal transduction; dark green, synapse organization; orange, learning or memory; light green, regulation of Rho protein signal transduction).

