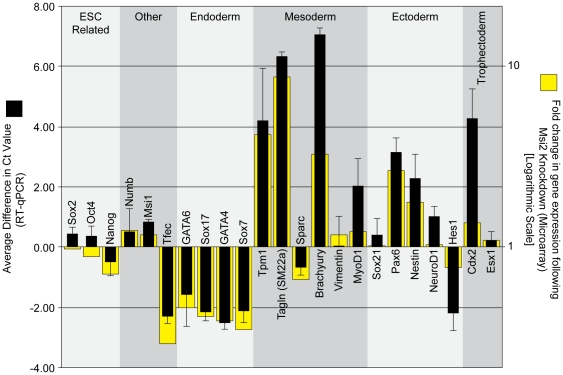
Figure 4. Knockdown of Msi2 in ESC leads to the expression of lineage-specific markers.
Seven days post-infection, RNA was isolated from the D3 ESC infected with lentiviruses that express either the scrambled (Scr) shRNA sequence or the Msi2 shRNA #1 sequence. Microarray analysis was used to assess global changes in gene expression (Fig. S2A). RNA expression for a select set of genes (yellow bars) is indicated as fold change, where a value >1 represents an increase in expression in cells treated with shRNA #1. All microarray data is available on Gene Expression Omnibus (Accession No. GSE33882, GEO, http://www.ncbi.nlm.nih.gov/geo/). Expression of this gene subset was verified by RT-qPCR (black bars). Threshold cycle (Ct) values were calculated by normalizing all Ct values to GAPDH then subtracting the Ct value for cells infected with Msi2 shRNA #1 from the Ct value for cells infected with the scrambled shRNA lentivirus. A positive Ct value indicates an increase in the level of the transcript in the Msi2 knockdown cells. Multiple rounds of RT-qPCR were used to calculate an average change in Ct value, and error bars represent standard deviation.

