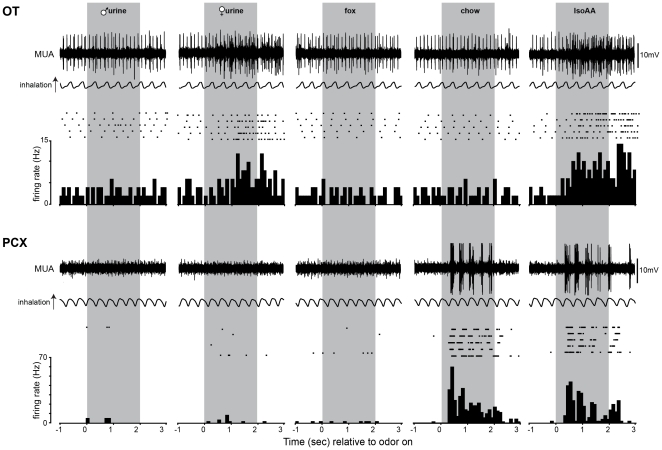
Figure 3. Example OT and PCX odor-evoked spike trains and stimulus histograms.
Multiunit activity (MUA) from a single OT (top) and PCX (bottom) recording. Also shown in raster and peristimulus time histogram (PSTH) form is the activity of a single isolated unit (1 unit/region) across each trial of odor presentation. For these purposes, we selected a spontaneously active OT example which is representative of the greater spontaneous firing among OT units versus those found in the PCX (Fig. 2). In this example, the PCX unit burst more phasic with respiration, though this is not consistent across all units. Units from both structures in these examples responded to 2 of the 5 odors.

