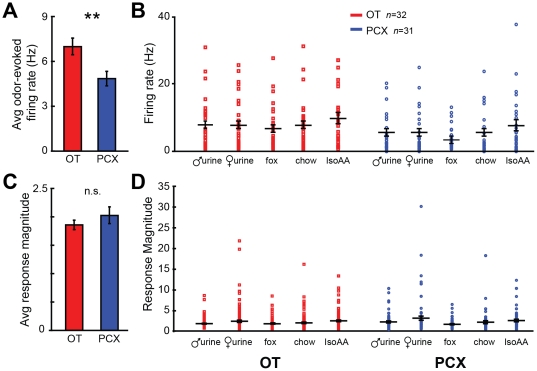
Figure 6. Odor-evoked spike rate, but not response magnitudes are greater in OT than PCX.
(A) Average odor-evoked firing rate of OT (left) and PCX units (right). Data ± SEM. **p<0.01, 2-tailed t-test. (B) Same rate data as in (A) but organized by odor. Each point represents average of 2 sec during odor, across >4 trials/unit. Horizontal bars = firing rate average across units ± SEM. (C) Average odor-evoked response magnitude (firing rate during odor as a proportion of that pre-odor) of OT and PCX units. Data ± SEM. n.s. = p>0.05, 2-tailed t-test. (D) Same magnitude data as in (C) but organized by odor. Each point represents average of 2 sec prior to odor, across >4 trials/unit. Horizontal bars = average ± SEM.

