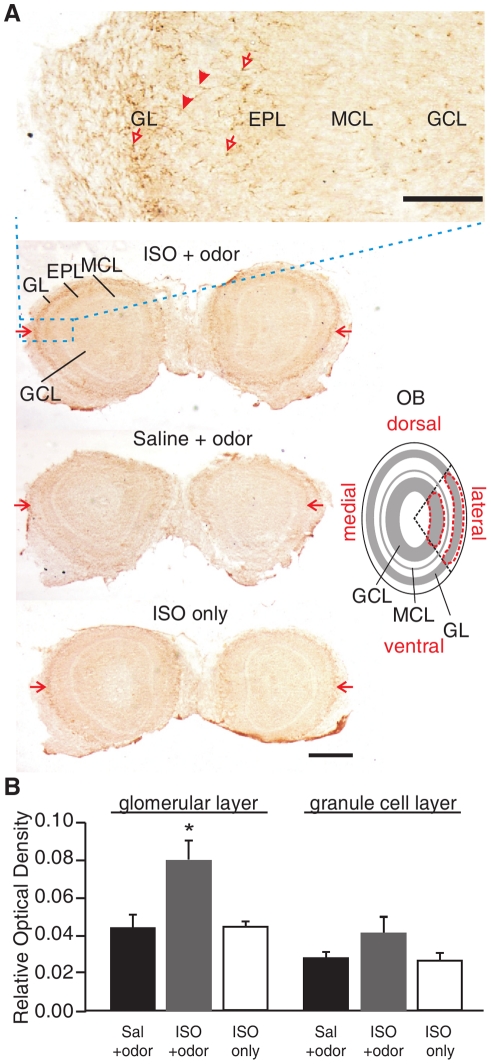
Figure 5. Early odor preference learning induced phosphorylation of the NMDA GluN1 (pGluN1) at 5 min following training.
A. Immunohistochemistry of pGluN1 expression in the olfactory bulb 5 min following the end of training. Red arrows in the low magnification images indicate the mid-lateral glomerular layers where most significant changes were observed. Inset shows high magnification of a portion of the active region. Arrow heads indicate mitral cell processes. Hollow arrows indicate glial-like staining. Schematic on the right shows the region of interest for optical imaging analysis. GL, glomerular layer. EPL, external plexiform layer. MCL, mitral cell layer. GCL, granule cell layer. OB, olfactory bulb. Scale bars, 100 µm (for inset) and 500 µm. B . Analysis of relative optical density of pGluN1 staining in glomerular and granule cell layers 5 min post-training. Values presented are the relative optical density of the lateral glomerular and granule cell layers for pGluN1. *p<0.05. Error bars, mean±SEM.

