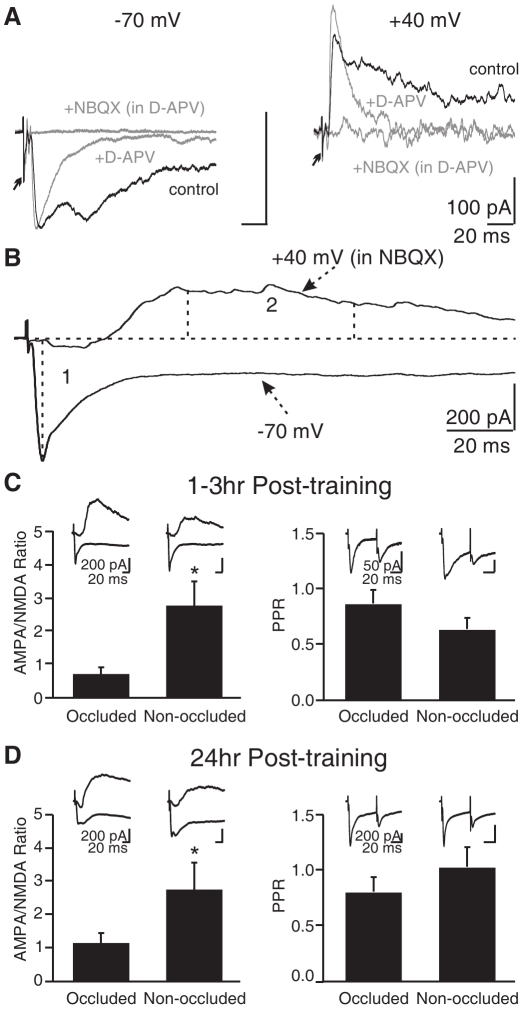
Figure 9. Early odor preference learning altered the ratio of MC AMPA/NMDA currents and the PPR in the olfactory bulb slices.
A. Pharmacological isolation of AMPA and NMDA EPSCs at −70 mV and +40 mV in one example cell. Arrows indicate truncated stimulation artifacts. B. An example cell showing the measurement of the AMPA component (1, peak at −70 mV) and the NMDA component (2, average of 50–100 ms following the stimulation at +40 mV). C. The AMPA/NMDA ratio and PPR 1–3 h post-training. D. The AMPA/NMDA ratio and PPR 24 h post-training. *p<0.05. Error bars, mean±SEM.

