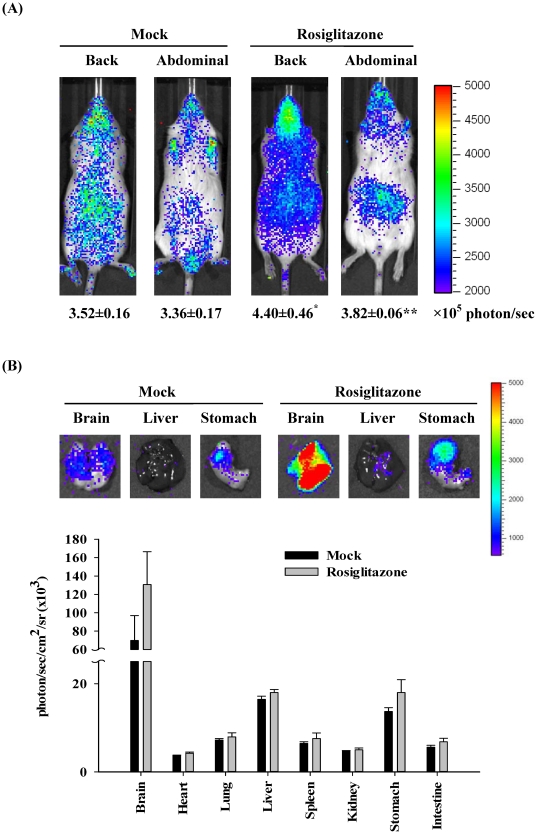
Figure 2. PPAR-dependent bioluminescence in living mice and individual organs.
(A) In vivo imaging. Transgenic mice were orally administered saline (mock) or 50 mg/kg rosiglitazone and imaged 6 hours later. The color overlay on the image represents the photon/sec emitted from the animals, as indicated by the color scales. Quantification of photon emission from the mice was shown at the bottom. Values are mean ± standard error (n=6 per group). *p<0.05, **p<0.01, compared with mock. (B) Ex vivo imaging. Transgenic mice were orally administered saline (mock) or 50 mg/kg rosiglitazone. Six hours later, mice were sacrificed and organs were subjected to image. Quantification of photon emission from the organs was shown at the bottom. Values are mean ± standard error (n=6 per group). Photos are representative images.

