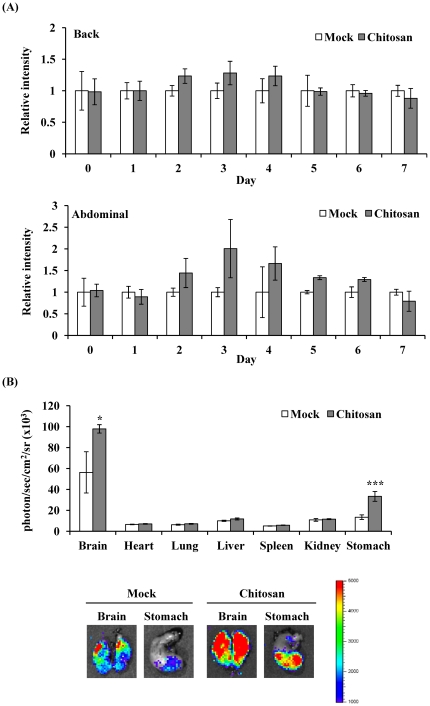
Figure 3. PPAR-dependent bioluminescence in living mice and individual organs after chitosan administration.
(A) Time course. Transgenic mice were subcutaneously injected saline (mock) or chitosan, and images at indicated periods. Results are expressed as relative intensity, which is presented as comparison with the luminescent intensity relative to mock. Values are mean ± standard error (n=6 per group). (B) Ex vivo imaging and quantification of photon emission from individual organs. Transgenic mice were subcutaneously injected saline (mock) or chitosan, and sacrificed 3 days later for organ imaging. Values are mean ± standard error (n=6 per group). *p<0.05, ***p<0.001, compared with mock. The color overlay on the image represents the photon/sec emitted from the organs, as indicated by the color scale. Photos are representative images.

