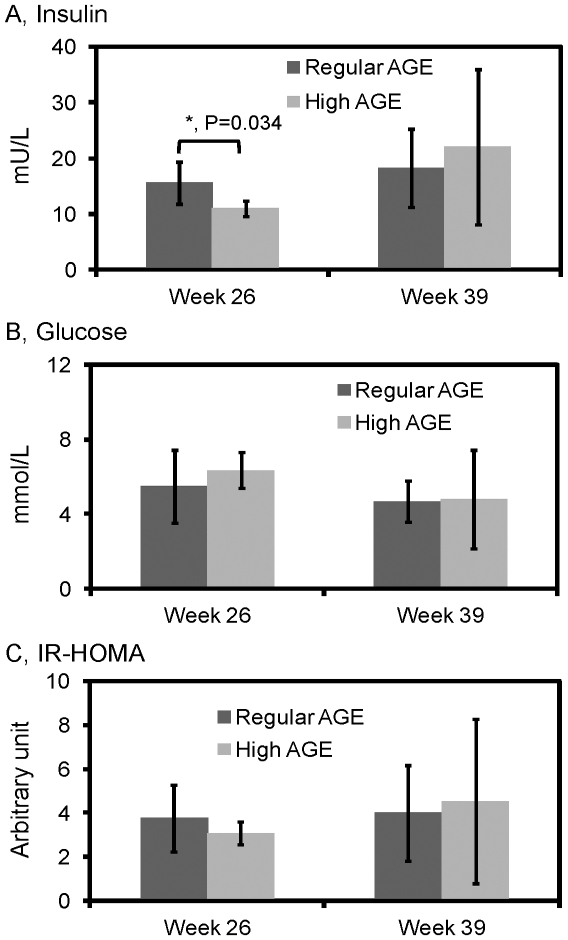
Figure 5. Intraperetoneal glucose tolerance test (IPGTT).
Mice fed with a high AGE diet (n = 3) or a regular AGE diet (n = 4) were subjected to IPGTT. Blood glucose levels were measured immediately before (time = 0 min) and after (time = 15, 30, 60, 120 min) an IP injection of glucose (2 mg per gram body weight). Error bars represent standard deviations with plus direction for the high AGE group and the minus direction for the regular AGE group.

