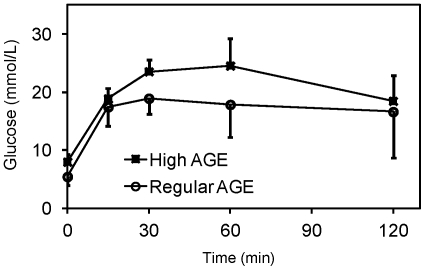
Figure 6. Measurement of fasting serum insulin, fasting blood glucose and insulin resistance.
Mice fed with a high AGE diet (n = 5) or a regular AGE diet (n = 5) for 26 and 39 weeks were analyzed. A, serum insulin levels were determined by an ELISA kit as specified in Materials and Methods; B, blood glucose was measured with a glucometer; C, insulin resistance was evaluated according to the “homeostasis model assessment (HOMA)” method [24]: IR-HOMA = fasting glucose (mmol/L) x fasting insulin (mU/L)/22.5. Error bars represent standard deviations.

