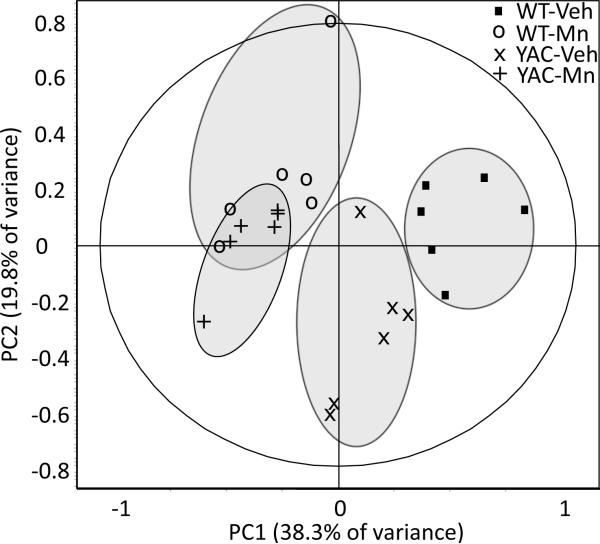
Figure 3.
Statistical analysis of striatal proteomic profiles of 13-week-old wild-type and YAC128Q mice exposed to vehicle or Mn. Forty-one protein spot features which intensities was significantly different between any of the four experimental groups (univariate two-way ANOVA, p<0.05 at 80% confidence interval) were subjected to principal component analysis (PCA). PC1 accounted for 38.3% and PC2 for 19.8% of the data variability. In the control conditions, wild-type (WT-Veh) and YAC128Q (YAC-Veh) samples were clearly separated on the PC1 × PC2 score plot, but Mn exposure made their proteomic profiles inseparable from each other. The grey colored ellipsis surrounding individual experimental groups do not represent any statistical certainty; they were drawn to facilitate visual analysis of the figure.

