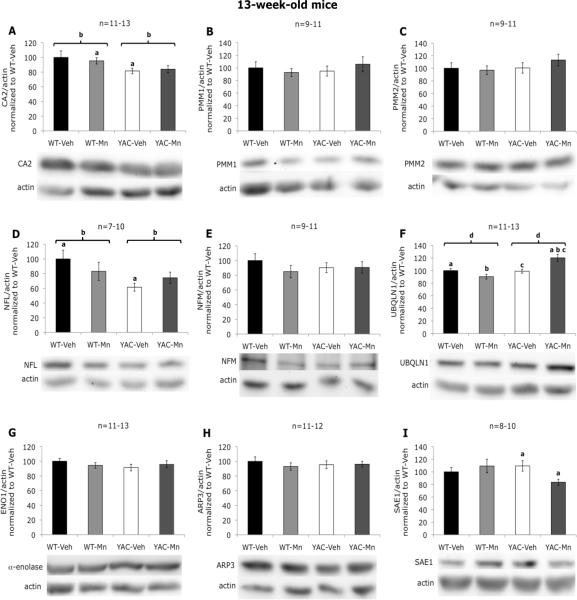
Figure 4.
Western blot analysis of selected proteins in striatum of 13-week-old mice. A, significant effect of genotype on carbonic anhydrase 2 levels was revealed (F(1,50)=6.36, p=0.015); a - statistically significant difference between WT-Mn and YAC-Veh was found (p=0.025); b - statistically significant difference between WT and YAC was found (p=0.015). B, no significant differences in phosphomannomutase 1 levels were found. C, no significant differences in phosphomannomutase 2 levels were found. D, significant effect of genotype on neurofilament light polypeptide levels was revealed (F(1,33)=5.14, p=0.031); a - statistically significant difference between WT-Veh and YAC-Veh was found (p=0.016); b – statistically significant difference between WT and YAC was found (p=0.022). E, no significant differences in neurofilament medium polypeptide levels were found. F, significant effect of genotype (F(1,50)=13.36, p=0.001) and genotype-exposure interaction (F(1,50)=15.32, p<0.001) on ubiquilin 1 levels were revealed; a, b, c - statistically significant differences between YAC-Mn and WT-Veh (p=0.004), WT-Mn (p<0.001), YAC-Veh (p=0.002) respectively were found; d - statistically significant difference between WT and YAC was found (p=0.004). G, no significant differences in alpha-anolase levels were found. H, no significant differences in actin-related protein 3 levels were found. I, significant effect of genotype-exposure interaction on SUMO-activating enzyme 1 levels was revealed (F(1,35)=4.81, p=0.036); a - statistically significant difference between YAC-Veh and YAC-Mn was found (p=0.016). Data are the means of actin-normalized optical densities ±SEM graphed as percentage of control (WT-Veh) group. The numbers of independent samples used in the experiments are indicated above the graphs. Bars are representing standard error, and the statistically significant differences between the experimental groups are indicated above the error bars (post hoc test; p<0.05).

