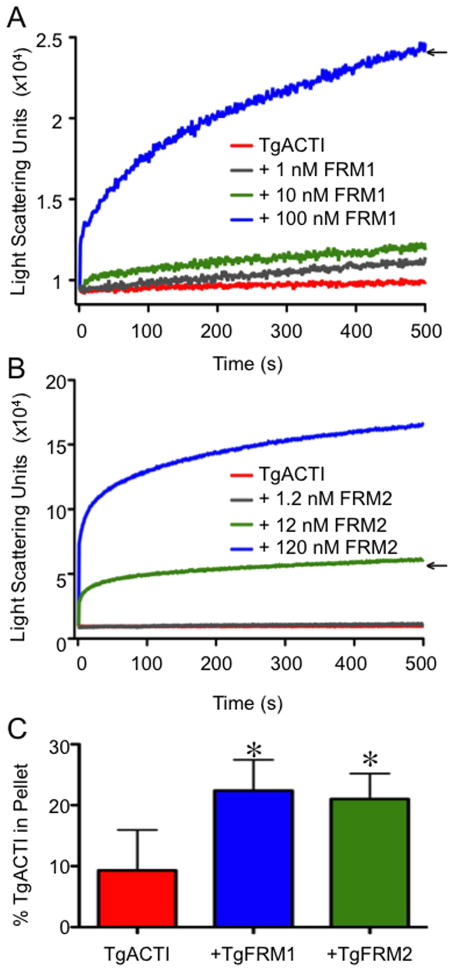
Figure 2.
TgFRM1-FH1-FH2 and TgFRM2-FH1-FH2 enhance polymerization of TgACTI. (A) Comparison of polymerization kinetics of TgACTI in the presence and absence of TgFRM1-FH1-FH2. Polymerization of 5 μM actin in F buffer alone (red) or with the addition of 1 nM (gray), 10 nM (green) or 100 nM (blue) TgFRM1-FH1-FH2 monitored by light scattering. Representative of 2 experiments. (B) Comparison of polymerization kinetics of TgACTI in the presence and absence of TgFRM2-FH1-FH2. Polymerization of 5 μM actin in F buffer alone (red) or with the addition of 1.2 nM (gray), 12 nM (green) or 120 nM (blue) TgFRM2-FH1-FH2 monitored by light scattering. Representative of 2 experiments. Concentrations chosen for subsequent experiments are denoted with arrows in A and B. Data in A and B were adjusted for levels of light scattering observed with FRM domains alone (although these changes were negligible). For comparison please note that the Y axes in A and B are different scales. (C) Upon completion of light scattering, samples of TgACTI alone or in the presence of 100 nM TgFRM1-FH1-FH2 or 12 nM TgFRM2-FH1-FH2 were centrifuged for 1 h at 100,000g to pellet actin filaments. Protein from the pellet or supernatants of all samples was resolved on a 12% SDS-PAGE gel, stained with SYPRO Ruby and quantified by phosphorimager analysis. The average percentage of protein in the pellet fraction from three replicate experiments is shown. Percent in the TgACTI pellet alone was compared to +TgFRM1-FH1-FH2 or +TgFRM2-FH1-FH2 and * denotes significance using Students two tailed t-test. P < 0.05.

