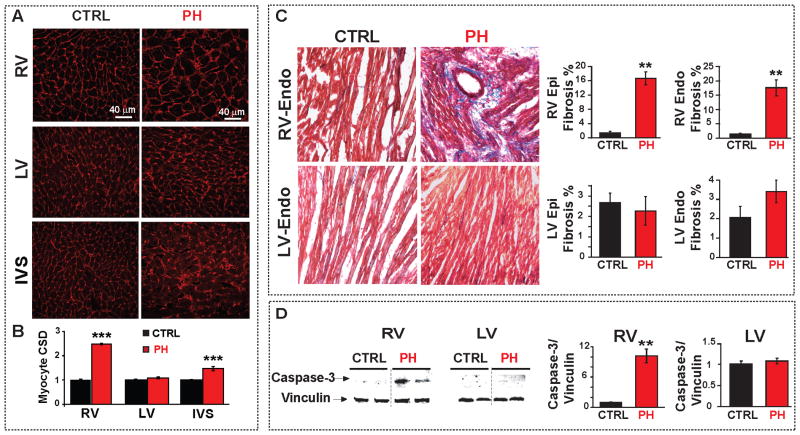
Figure 2.
Cardiac structural changes associated with PH-induced RV-failure. A. RV, LV and IVS sections stained with wheat germ agglutinin (red) in CTRL and PH hearts. B. Myocyte cross sectional diameter (CSD) of RV, LV and IVS comparing CTRL and PH groups. ***p<0.001 vs. CTRL. (n=3 rats per group and at least 60 cells per group). C. Masson trichrome staining of RV and LV-sections in CTRL and PH; blue color indicates fibrosis. Quantification of RV and LV-endocardial and epicardial fibrosis (%) is shown in the right panels. **p<0.01 vs. CTRL (n=3 rats per group). D. Representative immunoblots of RV and LV from CTRL and PH labelled with anti-caspase-3 and anti-vinculin antibodies. Mean levels of cleaved caspase-3 protein normalized to vinculin in CTRL (black bar) and PH (red) are shown at the right (**p<0.01 vs. CTRL, n=4–7 rats per group)

