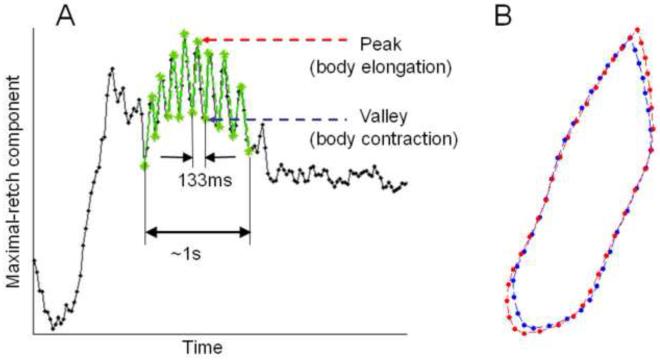
Fig. 6.
Plot of the first principal component score (the maximal-retch component). A) An example emetic episode was detected as a set of consecutive retches (~133 ms inter-retch interval with an emetic episode duration of ~1 s). B) The blue and red contours show the body with contraction (valleys) and elongation (peaks), respectively, during a retch.

