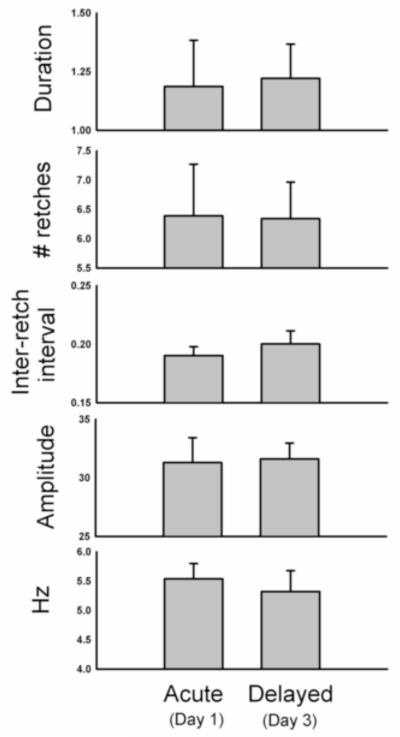
Fig. 9.
Details of emetic episodes during the acute (Day 1) and delayed (Day 3) phases after cisplatin treatment. These statistics were determined by computer analysis using the maximal-retch component measure and are based on all of the manually scored emetic episodes. See Methods section for details. Values represent mean ± SEMs (calculations are based on the mean of the mean values for each animal). These data were computed from 6 animals and 101 emetic episodes.

