
Figure 4.
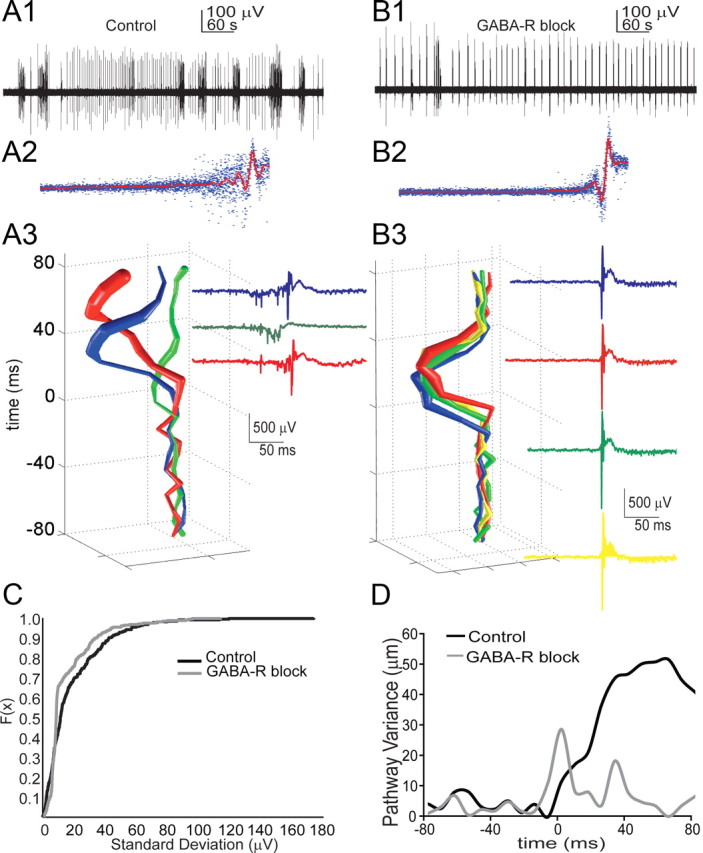
Interneurons sculpt the spread of IIS events. A1, Electrical field record of spontaneous interictal- and ictal-like activity in a slice culture. A2, Peaks for each individual spike were aligned (blue decimated traces, 87 events), and the mean waveform (red trace) was calculated for control conditions. The spread of the blue traces demonstrates the degree of variability present in the spike waveforms within a single culture. A3, Applying the spatial weighted averaging technique to IIS-related increases in calcium signal reveals that multiple spontaneous IIS events from a single culture propagate via distinct pathways. Electrical traces of each event are shown and color coded to correspond with propagation trajectories. B1, B2, Following GABA-R blockade (100 μm picrotoxin, 1 μm CGP 55845), interictal-like activity persisted and waveform variability decreased (B2; 107 events). B3, D, Following GABA-R blockade, the propagation patterns for the culture shown in A3 become stereotyped and the average distance between trajectories after GABA block is sharply reduced (D). C, A two-sample KS test on the SD of the electrical waveforms at each time point revealed distinct distributions for control vs GABA block <0.001; n > = 300 bursts, 4 cultures). Blocking GABA-R significantly reduced pathway variance (Mann–Whitney rank sum test, p = 0.006; n = 18 control; n = 17 GABA blocked bursts, 4 cultures).