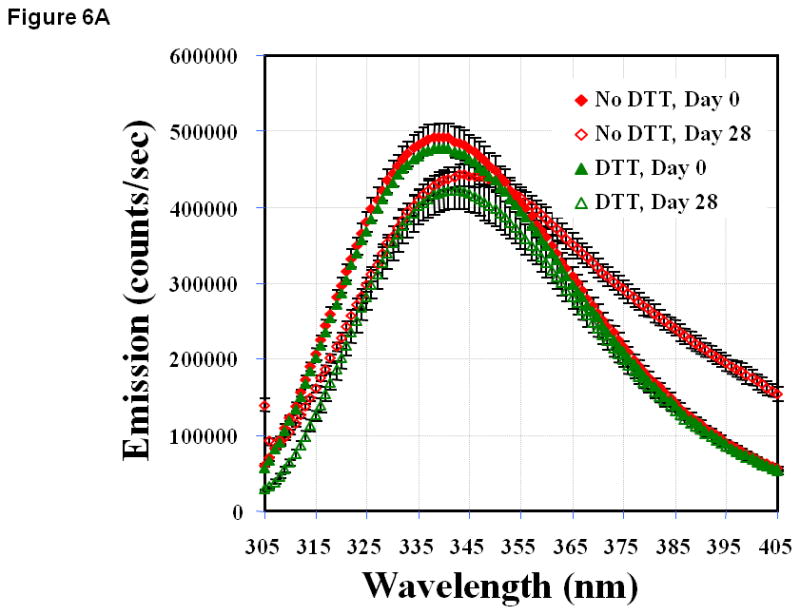
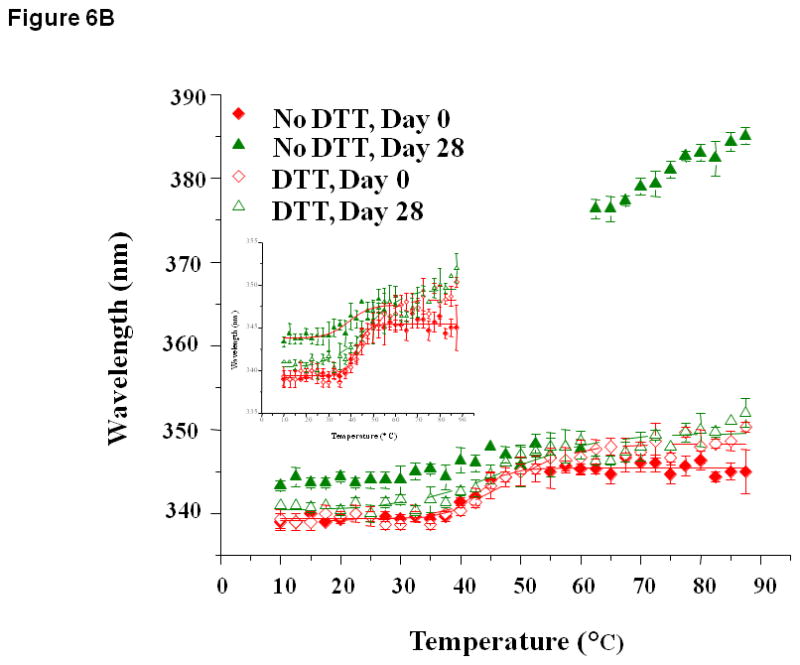
Figure 6.


(A) Fluorescence spectra of EC1 in the absence and presence of DTT after incubation at 4 °C for 0 or 28 days at pH 7.0. A shift in maximum emission to a higher wavelength is observed in the absence of DTT; however, this shift is inhibited by addition of DTT. (B) Thermal unfolding of EC1 in the absence and presence of DTT evaluated by change in the wavelength of maximum intrinsic fluorescence emission (after excitation at 295 nm) from 0 to 87.5 °C after incubation for 0, 14, or 28 days at 4 °C and pH 7.0. The inset is the scaled up unfolding profile to show the inflections in different incubation conditions.
