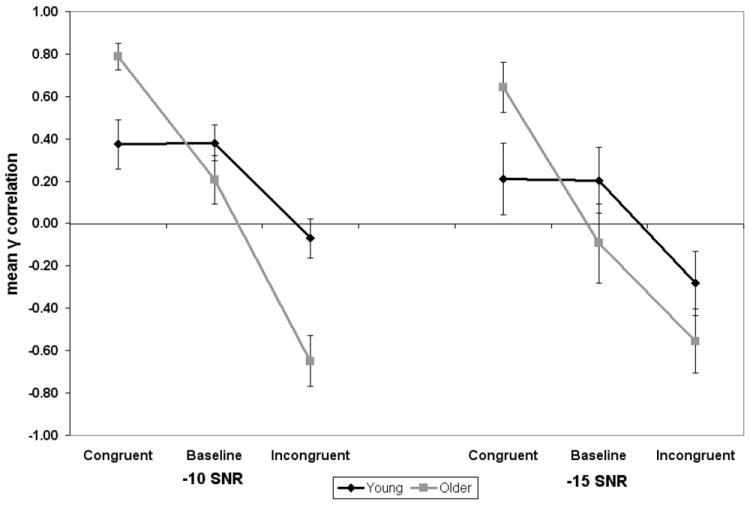
Figure 3.

Gamma (γ) correlation data from Experiment 1. Values above the zero line correspond to a positive relationship between confidence and accuracy (good monitoring), whereas values below the zero line correspond to a negative relationship between confidence and accuracy (poor monitoring). SNR denotes signal-to-noise ratio. Error bars represent standard errors.
