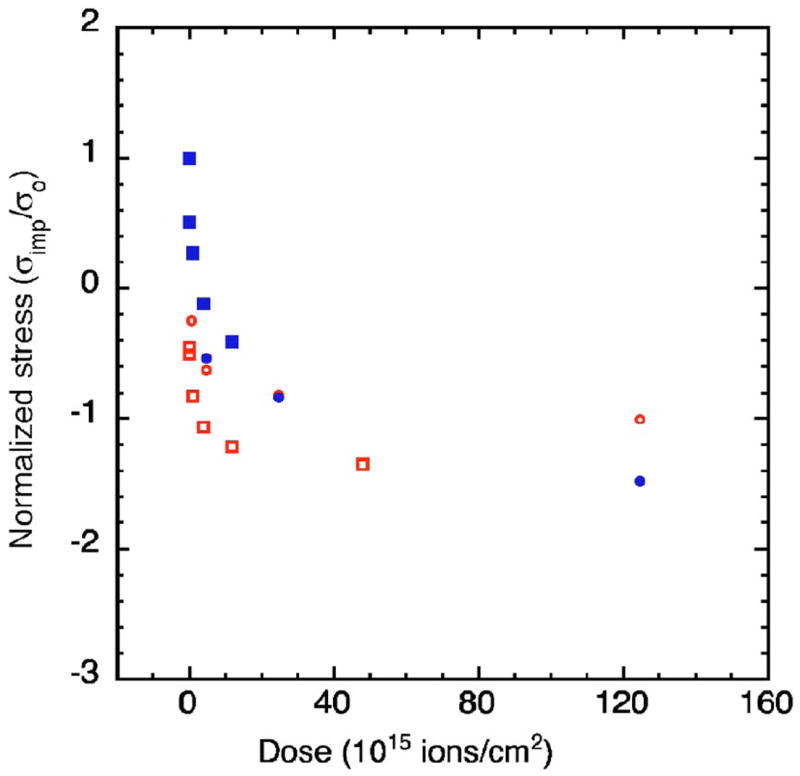
FIG. 12.

(Color online) Normalized ion-implantation-induced stress vs ion dose. The solid symbols represent the data for the low-stress nitride, whereas the open symbols represent the data for the high-stress nitride. The squares represent the results obtained from rectangular implanted areas, whereas the circles represent the results from circular areas.
