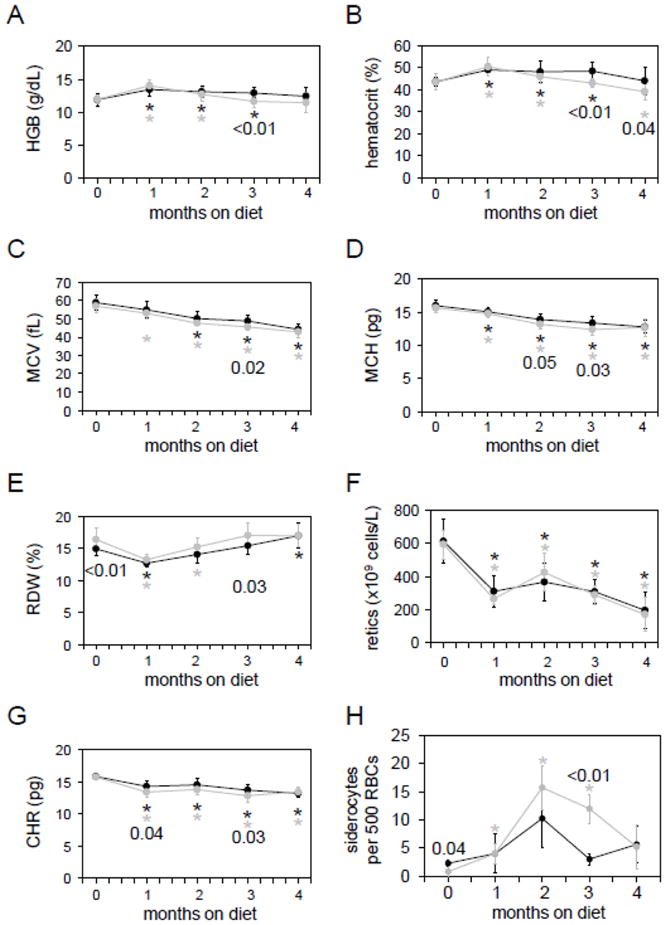
Figure 2. Analysis of Ftmt-deficient mice on a pyridoxine-deficient diet.

Wild-type (black lines and circles) and homozygous (grey lines and circles) mice were placed on a pyridoxine-deficient diet at one month of age and followed for four months. Parameters measured were (A) hemoglobin level (HGB), (B) hematocrit, (C) mean corpuscular volume (MCV), (D) mean corpuscular hemoglobin level (MCH), (E) red cell distribution width (RDW), (F) reticulocyte count (retics), (G) reticulocyte hemoglobin content (CHR) and (H) number of siderocytes per 500 red blood cells. Six to nine mice were analyzed per time point and genotype. Numbers indicate p values between wild-type and homozygous values at one time point; asterisks indicate value at that time point differs significantly (p<0.05) from initial value at 0 weeks. P values were determined by Student’s two-tailed t-test.
