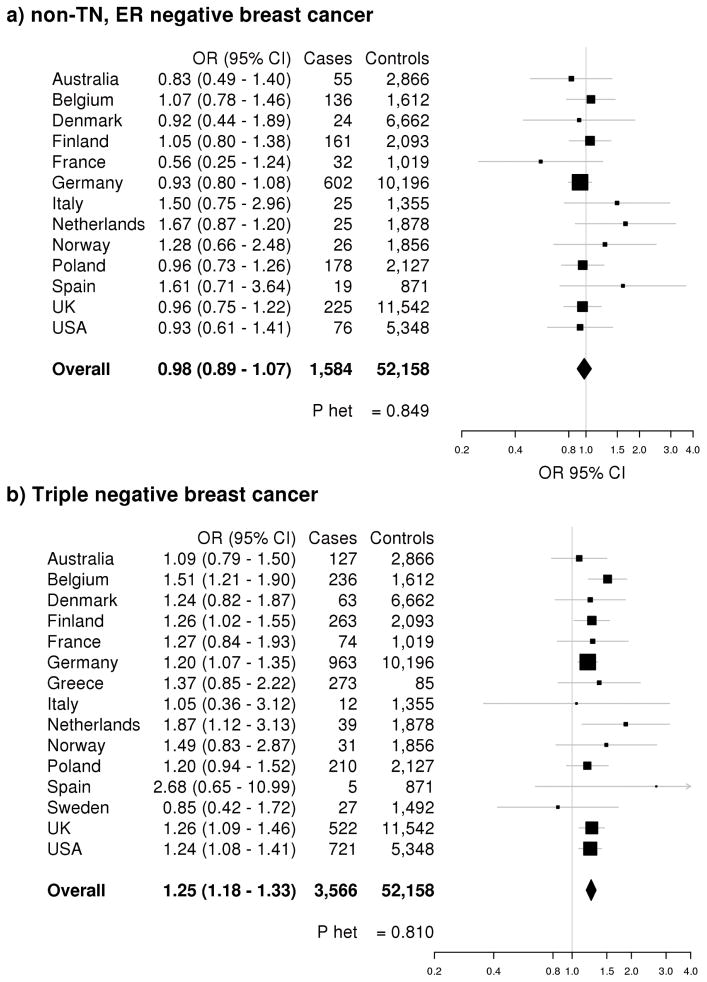
Figure 1. 19p13.1 (rs8170) association with risk of non-TN, ER-negative and TN breast cancer.
Forest plots for rs8170 and risk of (a) non-TN, ER-negative breast cancer and (b) TN breast cancer are shown by country. Country-specific odds ratios (95% CIs) are denoted by black boxes (black lines). Overall OR estimates are represented by black diamonds, where diamond width corresponds to 95% CI bounds. Box and diamond heights are inversely proportional to precision of the OR estimate. P-values for heterogeneity (pHet) of odds ratios by country are shown.

