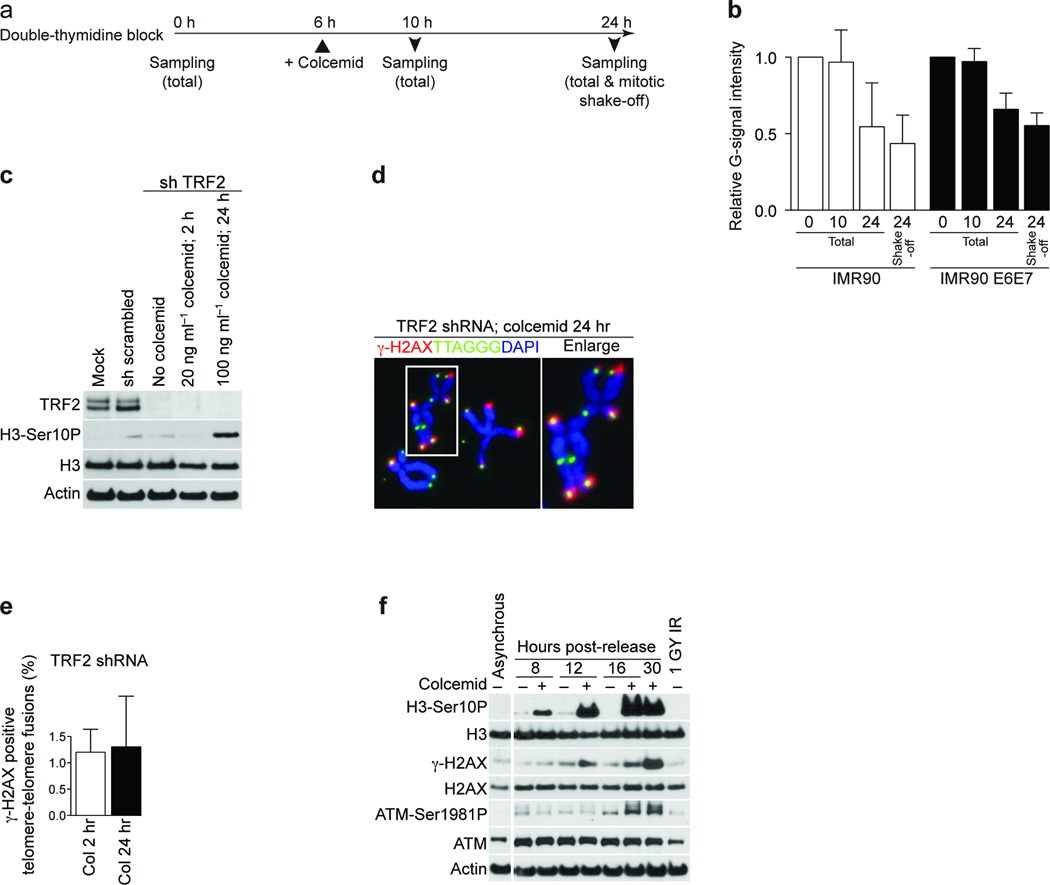
Figure 3.
Prolonged mitotic arrest causes the loss of 3’-overhangs and ATM activation. (a) Schematic of the timing of experiments in panel b. (b) Quantification of the ratio between native and denatured signals from telomeric southern analysis of IMR90 cells (white bars) or IMR90 E6E7 cells (black bars). The mean and standard deviation of three experiments is shown. (c) Western analysis of mock treated IMR90 E6E7 fibroblasts and cells expressing a scrambled shRNA or a shRNA targeting TRF2 with or without the indicated colcemid treatment. (d) Immunofluorescence image of metaphase chromosomes from IMR90 E6E7 cells with suppressed TRF2, exposed to 100 ng ml-1 colcemid for 24 hrs. (e) Quantification of γ-H2AX positive telomere fusions in IMR90 cells with suppressed TRF2, exposed to 20 ng ml-1 colcemid for 2 h or 100 ng ml-1 colcemid for 24 h. The mean and standard deviation of three experiments quantifying at least 135 fusions per experiment is shown. (f) Western analysis of asynchronous IMR90 fibroblasts and IMR90 cells released from G1-S arrest as shown. Where indicated, colcemid has been added 6 h after release.

