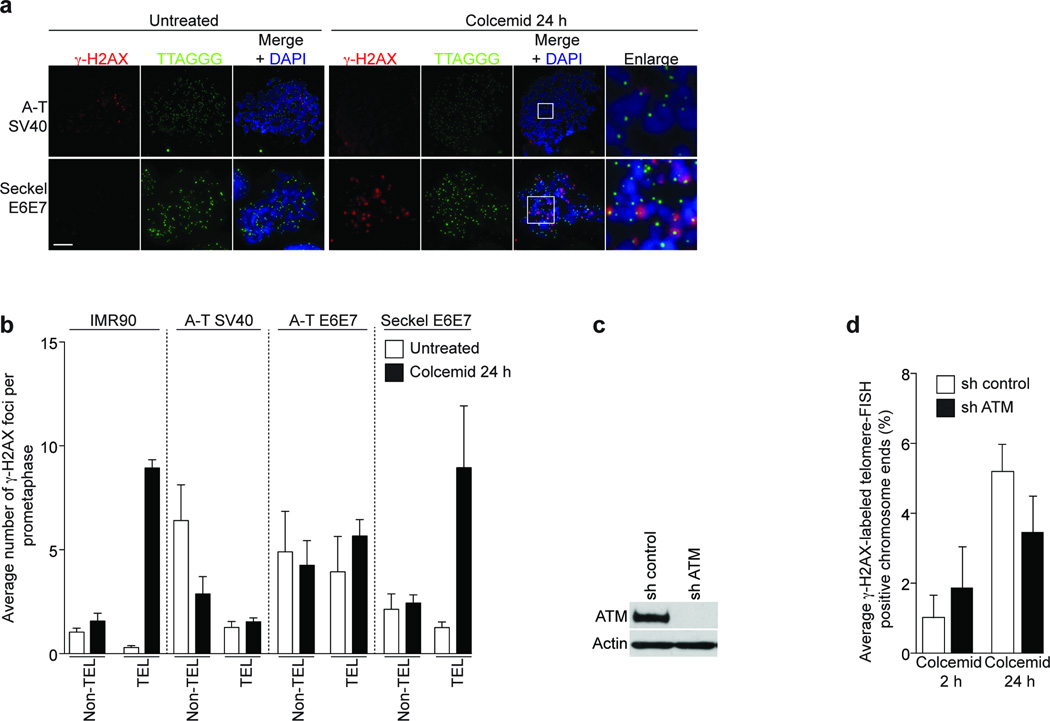
Figure 4.
Mitotic TIF formation is ATM dependent. (a) Immunofluorescence staining of A-T SV40 and Seckel E6E7 fibroblasts treated with colcemid for 24 h. Magnifications of indicated regions are on the right. (b) Quantification of γ-H2AX foci in IMR90, A-T SV40, A-T E6E7 and Seckel E6E7 metaphases. Displayed as in Fig. 1e. The mean and standard deviation of three independent experiments of 25 or more metaphases is shown. (c) Western analysis of ATM targeting in HeLa1.2.11 cells. (d) Quantification of meta-TIF in ATM targeted HeLa1.2.11 cells. Displayed as in Fig 1c. Scale bar, 10 µm.

