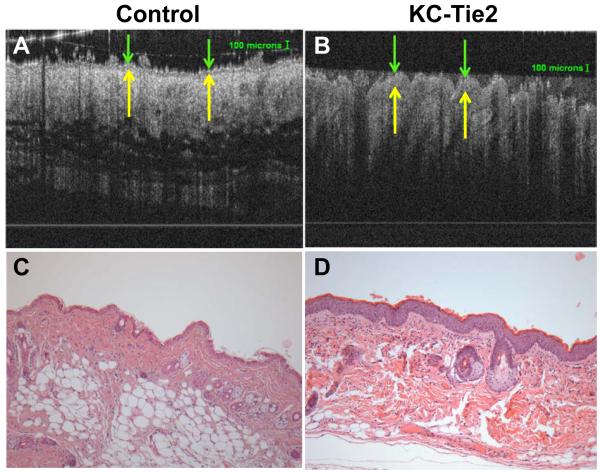
Figure 1. Noninvasive OCT imaging and standard histological methods can be used to measure epidermal thickness in control and KC-Tie2 mouse skin.
Representative OCT images (A-B) and H&E stained skin (C-D) taken from the same dorsal skin region of control (A, C) and KC-Tie2 (B,D) mice. Green arrows indicate the apical surface of the skin and yellow arrows demarcate the dermo-epidermal junction.

