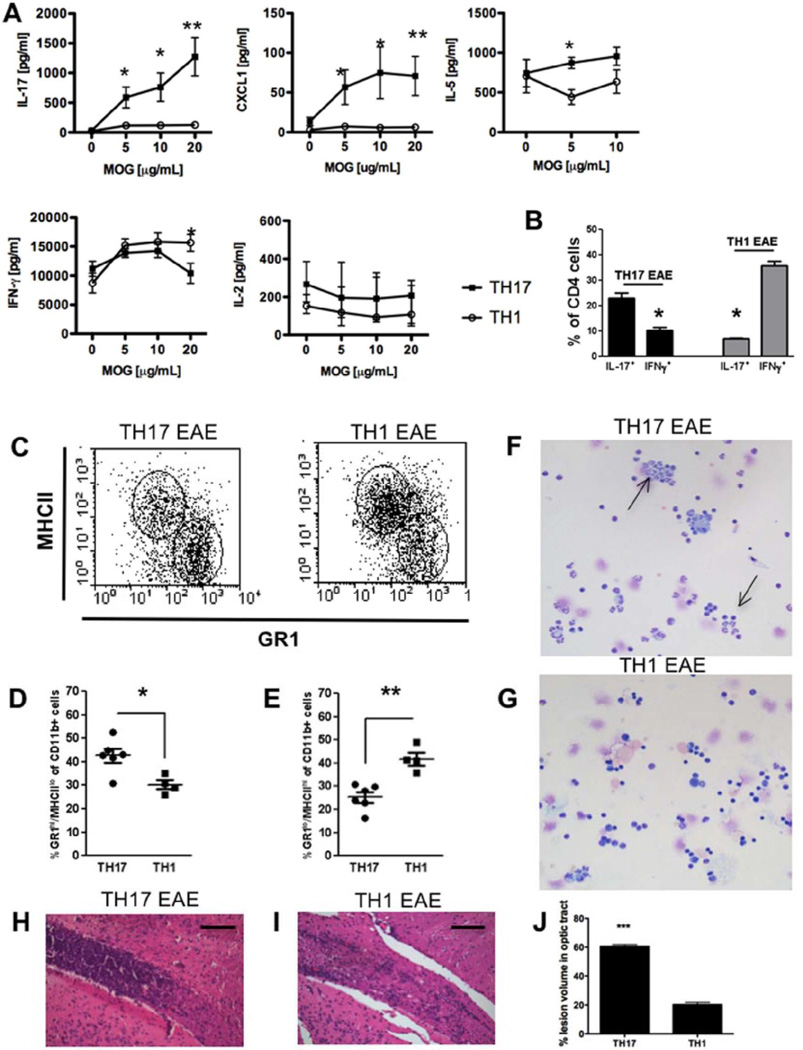
Figure 2. Phenotypic differences in Th17 and Th1-induced experimental autoimmune encephalomyelitis.
To induce Th1 and Th17 experimental autoimmune encephalomyelitis (EAE), donor mice were sacrificed 10 days after MOG immunization (see methods) and spleens and draining lymph nodes were isolated and restimulated with 20 µg/ml MOG35–55 in the presence of IL-12 (Th1) or IL-23 (Th17) for 3 days and transferred to healthy recipient mice to induce EAE. (A) Quantification of levels of IL-17, CXCLI, IL-5, IFN-γ and IL-2 in spleen culture supernatants of Th17 and Th1 EAE animals at peak of disease after 3 days of restimulation with MOG35–55. Cytokine secretion was measured by ELISA. Results are shown as mean ± SEM of three animals per group. IFN-γ:*p < 0.04; IL-17: *p < 0.023 **p < 0.005; CXCLI:*p < 0.039 **p < 0.008; IL-5: *p < 0.026.
(B) Flow cytometry analysis of IFN-γ and IL-l7-secreting CD4+cells from central nervous system (CNS) of Th17 and Th1-induced EAE mice at peak of disease. *p < 0.05.
(C–E) Flow cytometry analysis of MHCII+ and GR1+ cells of CD11b+ cells from CNS of Th17 and Th1-induced EAE mice at peak of disease (C). Quantification of GR1hiMHCIIlo (D) and GR1loMHCIIhi (E) cells of CD11b+ cells from CNS. Data represent individual values of 4–6 animals, mean and SEM.*p < 0.03,**p < 0.002.
(F, G) Representative microphotographs of CNS infiltrates of Th17 (F) and Th1 (G) -induced EAE mice isolated by cytospin. Cells were stained by Wright–Giemsa. Arrows show neutrophilic polymorphonuclear cells.
(H, I) Histology of inflammatory infiltrates in the optic tract of Th17 (H) and Th1 (I)-induced EAE stained with H&E at the peak of disease. Scale bars: 100 µm.
(J) Quantification of lesion volume in optic tract of Th17 and Th1-induced EAE presented as percentage of lesion volume of the optic tract.

