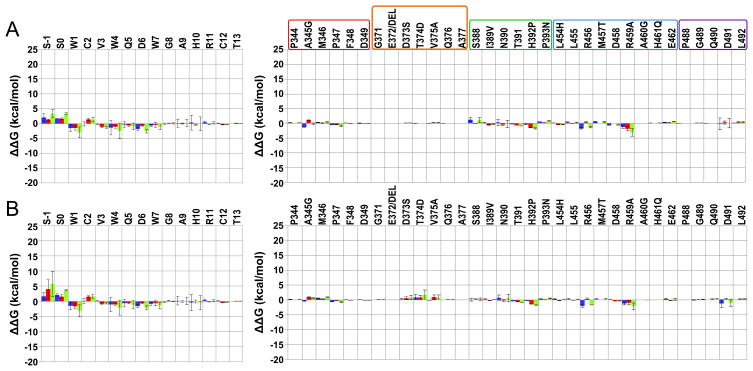
Figure 2.
Residue intermolecular interaction energy differences between the complex W4A9:hC3 [15] and selected complexes of this work. Compstatin and C3 results are in the left and right panel. Data are averaged over all respective runs. The colored code used is: blue – polar; red – non-polar; and green – total. The uncertainties (error bars) are computed as described in methods. (A) W4A9:hC3 – S-1S0:R difference; (B) W4A9:hC3 – S-1S0:M difference. Positive/negative values indicate, respectively, gained/lost interactions in the present complexes, relative to the W4A9:hC3 complex [15]. C3 regions interacting with compstatin analogs are enclosed in boxes in (A), colored as follows: red – sector 344–349; orange – sector 371–376; green – sector 388–393; blue – sector 454–462; and purple – sector 488–492. An additional residue, A377, is shown in the orange box to account for possible compensatory effects due to the E372 deletion with respect to human C3 (not present).

