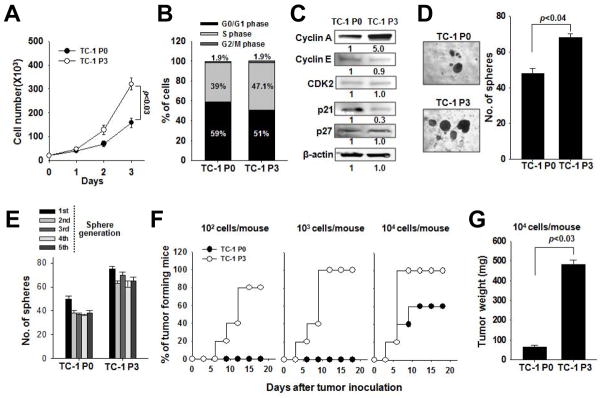
Figure 1. Growth and tumorigenicity of immune-resistant cancer cells selected by vaccination.
(A) Live P0 or P3 cells were counted at each time point after trypan blue staining. (B) Cell cycle stages of cells was measured by flow cytometry. (C) Expression of cell cycle proteins was determined by Western blot from 50 μg of lysate. (D) P0 or P3 were cultured in low density suspension conditions to promote sphere formation (left). The number of spheres per well was quantified (right). (E) P0 or P3 spheres were serially passaged for 5 rounds, and the number of spheres per well was quantified at each cycle. (F) P0 or P3 cells were inoculated at different doses into NOD/SCID mice and tumor formation was monitored. (G) 18 days after challenge, tumors were explanted and weighed from the mice challenged with 104 cells. Data are representative of three independent experiments.

