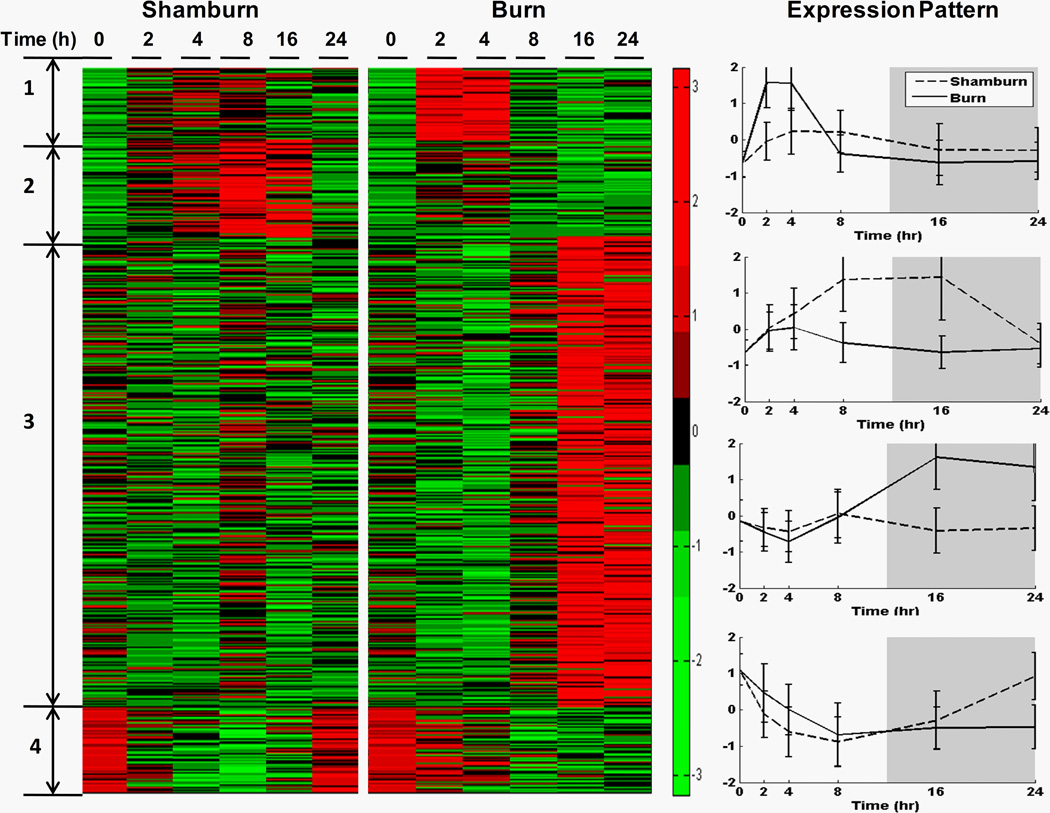
Figure 2. Gene expression profiles of rat livers in response to sham-burn or burn injury.
Left Panel, expressions of 62, 82, 404 and 73 probesets in 4 clusters in sham-burn rats and burn rats at 0, 2, 4, 8, 16, 24 h post-treatment are exhibited in a heatmap.
Right Panel, the expression patterns are shown by plotting the average normalized (z-score) expression values of 62, 82, 404 and 73 probe sets in 4 clusters in sham-burn and burn groups (displayed as the means ± SEM).

