Fig. 4.
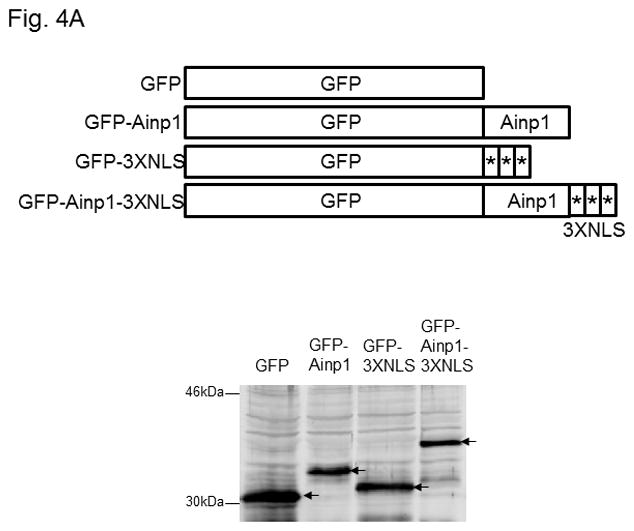
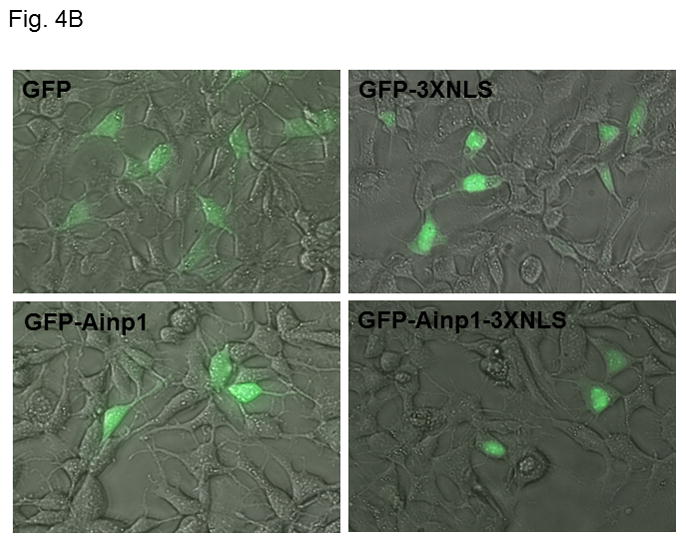
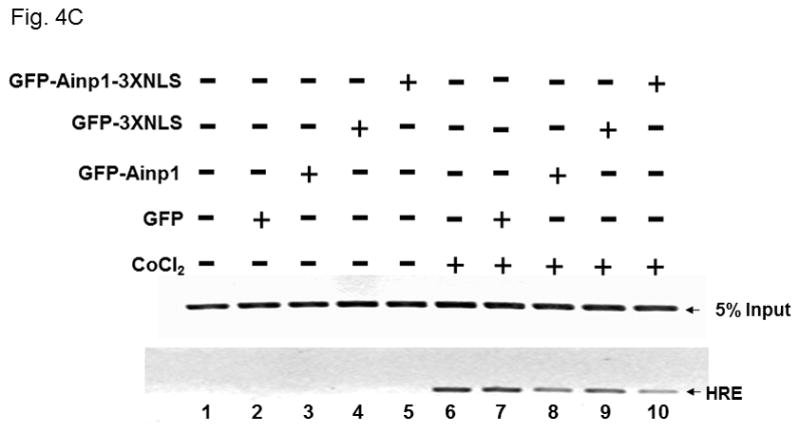
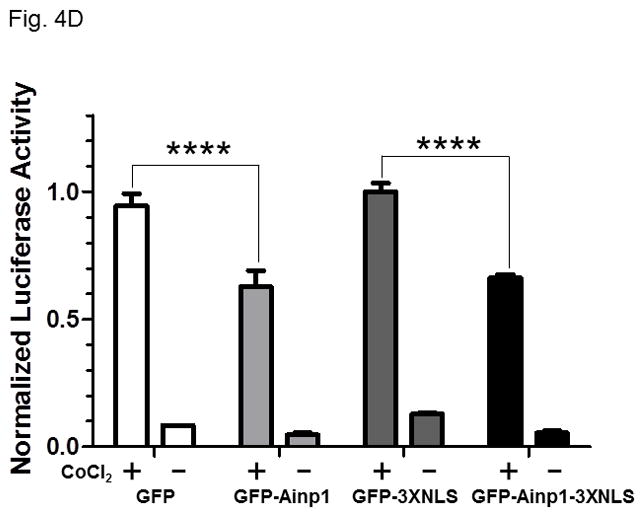
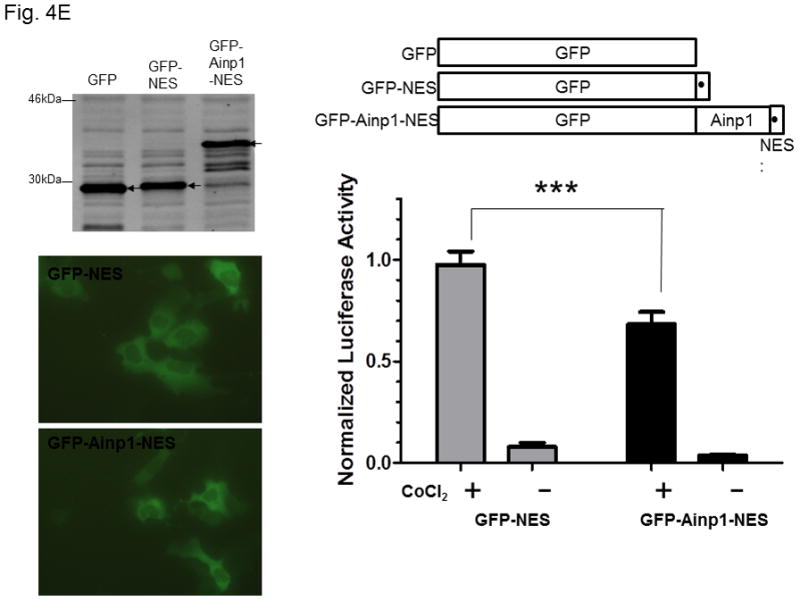
Ainp1 suppressed the HIF-1α function in Hep3B cells. Western analysis (A) and fluorescence imaging (B) were performed 24 hours after transfecting cells (1 × 10⁵) with pGFP2-C1, pGFP2-Ainp1, pGFP2-3XNLS or pGFP2-Ainp1-3XNLS plasmid (1.6 μl FuGene HD/800 ng plasmid). Each Western lane contained 30 μg of WCE. Fluorescence images were superimposed with the phase contrast images to show the cell shape. C, ChIP data showing that Ainp1 suppressed recruitment of ARNT to the vegf promoter. Cells (4 × 10⁶) ± 300 μM CoCl2 were transfected with GFP, GFP-Ainp1, GFP-3XNLS or GFP-Ainp1-3XNLS expressing plasmid (30 μg by electroporation at 160V, 70ms). Anti-ARNT IgG was used to precipitate the HRE-containing complex and the PCR products of the precipitated HRE fragment are indicated by the bottom arrow. 5% input refers to the band intensity of 5% of total ARNT content in the starting sample. D, GFP-Ainp1 and GFP-Ainp1-3XNLS suppressed the reporter luciferase activity to a similar extent in Hep3B cells. Cells (± 100 μM CoCl2) were transfected with the same amount of plasmid DNA (pGFP2-C1, pGFP2-Ainp1, pGFP2-3XNLS or pGFP2-Ainp1-3XNLS). Amount of plasmid DNA used: 0.6 μg of GFP, GFP-Ainp1, GFP-3XNLS or GFP-Ainp1-3XNLS, 150 ng of pGL3-Epo reporter luciferase plasmid, and 50 ng of pCH110 plasmid. GFP and GFP-3XNLS were set as 1 for comparison. This experiment was repeated once with similar results. Error bars indicate the variations of the means (mean ± SD, n = 3). ****p < 0.0001. E. Western analysis and fluorescence imaging were performed similarly as in A and B except that TurboFECT from Fermentas (1.6μl/800ng plasmid) was used in instead of Fugene HD. Arrows indicates the corresponding bands. Cytoplasmic localization of GFP-NES and GFP-Ainp1-NES was observed even without the superimposed phase contrast images. Luciferase experiment was performed using XtremeGENE 9 (Roche, Indianapolis, IN) (0.75 μl/ 0.25 μg plasmid). Amount of plasmid DNA used: 0.2 μg of GFP-NES or GFP-Ainp1-NES, 40 ng of pGL3-Epo reporter luciferase plasmid, and 10 ng of pCH110 plasmid. GFP-NES was set as 1 for comparison. This experiment was repeated once with similar results. Luciferase activity in 4D and E was normalized by the β-galactosidase activity. Error bars indicate the variations of the means (mean ± SD, n = 3). ***p < 0.001.
