
Fig. 5.
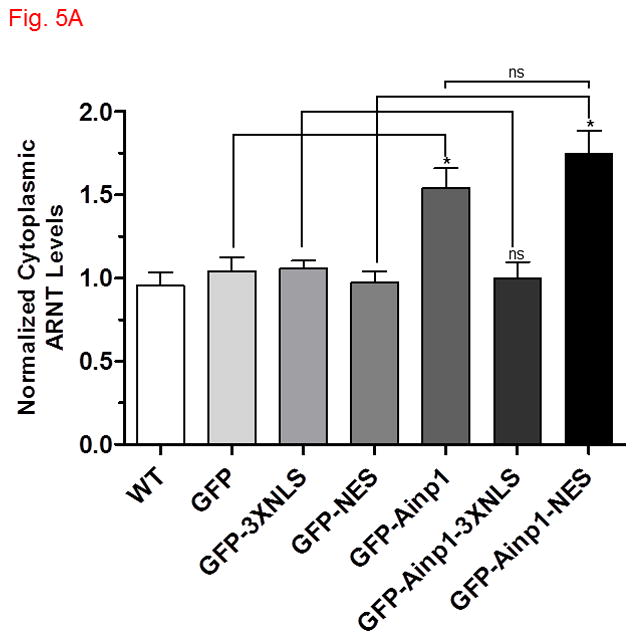
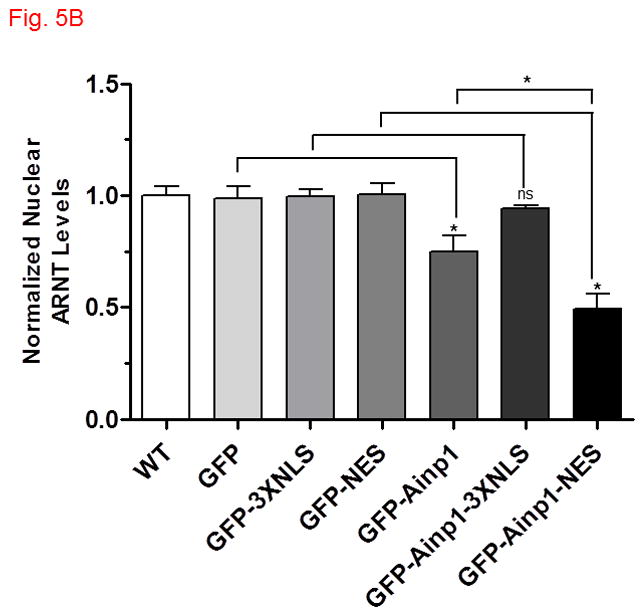
Ainp1 sequestered ARNT in the cytoplasm. The ARNT levels were determined in various cytoplasmic and nuclear fractions by Western using a LI-COR Odyssey imaging system. (For Western images, see Fig. S4A-E in supplementary content.) Hep3B cells were either untransfected (WT) or transfected with a plasmid expressing GFP, GFP-3XNLS, GFP-NES, GFP-Ainp1, GFP-Ainp1-3XNLS or GFP-Ainp1-NES. The cytoplasmic (A) and nuclear (B) ARNT levels were normalized by arbitrarily setting the corresponding average WT value as one. Statistics were calculated from four replicates (n = 4) of all conditions except for GFP-NES and GFP-Ainp1-NES from five replicates (n = 5). Error bars indicates mean ± SD. *p < 0.05; ns, not significant.