Figure 2.
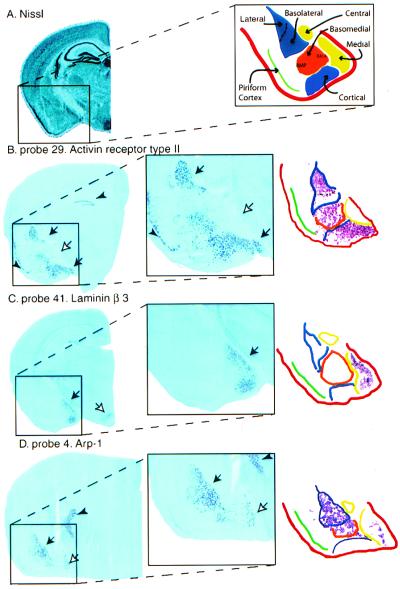
In situ hybridization of amygdala-enriched genes. (A) Nissl staining of a coronal section (left side of the brain). To the right, a schematic representation of various amygdala subnuclei is shown. Cortical-like nuclei (lateral, basolateral, and cortical) are shown in blue. Striatal-like subdivisions (central and medial) are in yellow, and the basomedial region is in orange (BMP = basomedial, posterior; BMA = basomedial, anterior). (B–D) Low magnification pictures of the left hemibrain. Amygdala details are shown in the magnified area (boxes). To the right are computer-aided schematics of staining in the amygdaloid region. Note that the nuclear boundaries vary slightly depending on the axial level. Color boundaries of subnuclei follow the diagram from A. (B) Probe 29 (activin receptor type II, TIGR identifier TC35462). Intense labeling in the lateral, basomedial, and cortical amygdala is apparent (black arrows). Note that the medial nucleus is devoid of staining (white arrow). No signal was detected in the cerebellum or PAG. Very few cells were stained in the olfactory bulb (not shown). A sense probe (not shown) labeled the hippocampus and piriform cortex (arrowheads) in the same way as the antisense probe, so the signal in these regions may be mainly caused by nonspecific hybridization. (C) Probe 41 (laminin β3, GenBank accession no. U43298). Signal is visible in the medial amygdala (black arrow) and ventromedial hypothalamus (white arrow). No staining was detected in cerebellum, hippocampus, olfactory bulb, and PAG (not shown). (D) Probe 4 (arp-1, GenBank accession no. X76653). Strong signal is detected in the lateral and basolateral complexes (black arrow). Note also weaker signal in the medial amygdala (white arrow). The reticular thalamic nucleus also showed clear hybridization (arrowhead). No staining was detected in the other four regions examined on microarrays (not shown).

