
Fig. 3.
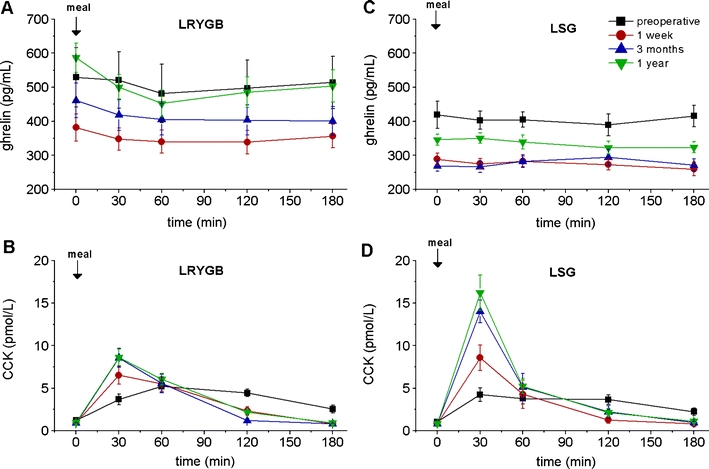
Fasting and meal-stimulated time courses of ghrelin and CCK in the two groups of patients (LRYGB and LSG) before, as well as 1 week and 3 and 12 months after the respective operation. a Ghrelin in the LRYGB group, b CCK in the LRYGB group, c ghrelin in the LSG group, d CCK in the LSG group. Data are means ± SEM. Details on the statistical analysis are given in Table 3